Advertisement
Home Prices to Skid Through Q4 Right Into 2012

Clear Capital has released its monthly Home Data Index (HDI) Market Report, with news of U.S. home price gains of 3.5 percent comparing the most current rolling quarter through September, to the previous one. Also, the company published its first glimpse into 2012, providing a forecast through the first quarter, and while prices increased this most recent quarter, the company forecasts a small skid in prices for the fourth quarter of 2011, and a continued slide in home prices through the end of the first quarter of 2012.
Report highlights include:
►U.S. quarter-over-quarter home price gains continue to soften, posting a 3.5 percent increase, versus growth of four percent reported in September’s report.
►The Clear Capital forecast predicts U.S. home prices to drop 1.6 percent over the final quarter of 2011, and 3.2 percent by the end of Q1 2012.
►Year-over-year price changes remain negative at -3.8 percent.
►At the regional level, the midwest continues to lead the nation with a quarterly home price gain of 7.2 percent, followed by the northeast at 3.5 percent, south at 3.2 and west at 0.3 percent.
►This projected drop through Q1 2012 moves prices closer to Q1 2011 prices, the lowest since the downturn began.
“The September home price measures show continued slowing of the price gains we’ve seen this year, especially across the spring and summer months,“ said Dr. Alex Villacorta, director of research and analytics at Clear Capital. “The housing market has yet to demonstrate the fundamentals necessary to overcome a seasonal slowdown over the next six months, which drives our projected 3.2 percent drop in national home prices through the first quarter of 2012.
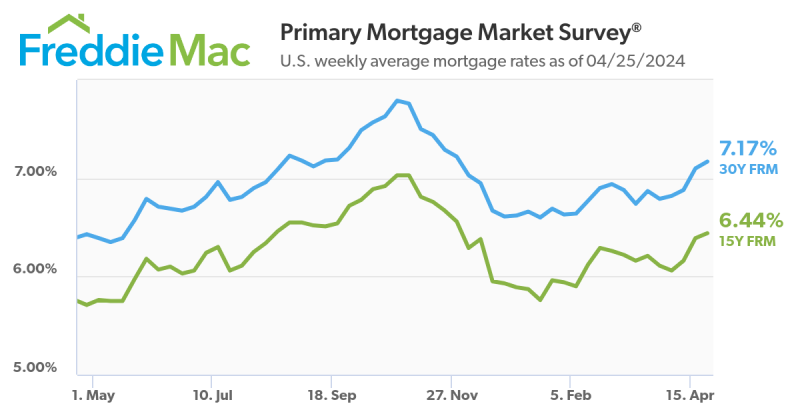
“The normally positive market forces of record low mortgage rates and near record lows in home prices are being offset by high unemployment rates and general consumer pessimism about the economic future,” said Villacorta. “Until we experience a more stable economic environment, I expect home prices to remain relatively flat or slightly down for the foreseeable future.”
Summer price momentum continues to fade
Data shows that since mid-spring, national rolling quarter-over-quarter prices gained 3.5 percent through September, compared to a four percent change reported through August. Although prices are still up, the tide appears to be turning and these gains are expected to halt as early as next month. The resurgence in home price values over the last four months is best explained as the bounce back from the double dip observed in the first quarter of this year. As market prices move farther away from that low point, quarterly price changes will reflect the slowdown in price growth and yearly home price changes will show the stagnant environment that the market is in presently.
At the regional level, home prices in the West are sluggish with quarterly gains of a mere 0.3 percent over the period. Price movements in the Midwest and South are virtually unchanged from last month, when quarterly prices were up 7.3 percent and 3.5 percent, respectively. The quarterly 3.5 percent price gain experienced in the Northeast was a considerable cooling off from the 4.9 percent gains reported for the region last month.
When rolling year-over-year numbers are considered, prices across the nation were down -3.8 percent from September 2010. While the nation is still struggling with year-over-year losses, one bit of good news is that the Midwest was able to recover from the -9.8 percent yearly decline posted last month with a decrease this month of -4.9 percent, putting it more in line with the rest of the nation.
Real estate-owned (REO) saturation continues to improve across the country with only slightly more than one-quarter of homes (25.3 percent) selling as distressed. This rate is down 9.2 percentage points since May and down 15.6 percentage points since the it peaked in the first quarter of 2009. The current REO saturation rate is an encouraging sign that the summer buying season saw increased sales in the non-distressed segment, which helped support price growth.
Highest performing markets: The midwest
The midwest markets held their ground at the top of the highest performing markets list with seven metro markets represented. Cleveland maintains its momentum as the highest performing market in this quarter with an 18.2 percent increase in prices, with Chicago and Columbus, Ohio in the third and fourth positions. Cleveland’s return to the top of this list underscores the positive yearly gains for this low-priced and volatile market.
Overall, New Orleans and Columbus were the largest movers compared to last month. New Orleans was up 4.9 percentage points to post 11.2 percent quarterly gains, while Columbus jumped seven percentage points to post 10.1 percentage point gains. In the west, markets have stubbornly resisted the short term gains of the summertime home buying season, with Honolulu flying solo amongst the highest performing markets.
Lowest performing markets ... the west
Las Vegas was the hardest hit in this month’s numbers, with a -1.7 percent price change over the most recent rolling quarter. However, Detroit has deteriorated the most over the long run with a -14.5 percent year-over-year price change. Performance in the west remains dismal, with the vast majority of the 15 lowest performers coming from this region, including all seven of the California markets reported on. However, it is important to note that while California is over-represented in the lowest performing 15 markets this month, the magnitude of yearly declines and overall volatility for that market has been mild relative to recent years.
On a positive note, the lowest performing markets experienced a collective improvement this month as the spread of quarterly price changes narrowed, ranging from -1.7 percent to 1.4 percent, when compared to recent market reports. Further, the number of markets returning double digit yearly declines has dropped to only four, while REO saturation rates continued to decline by an average of 0.7 percentage points from last month’s report.
About the author


