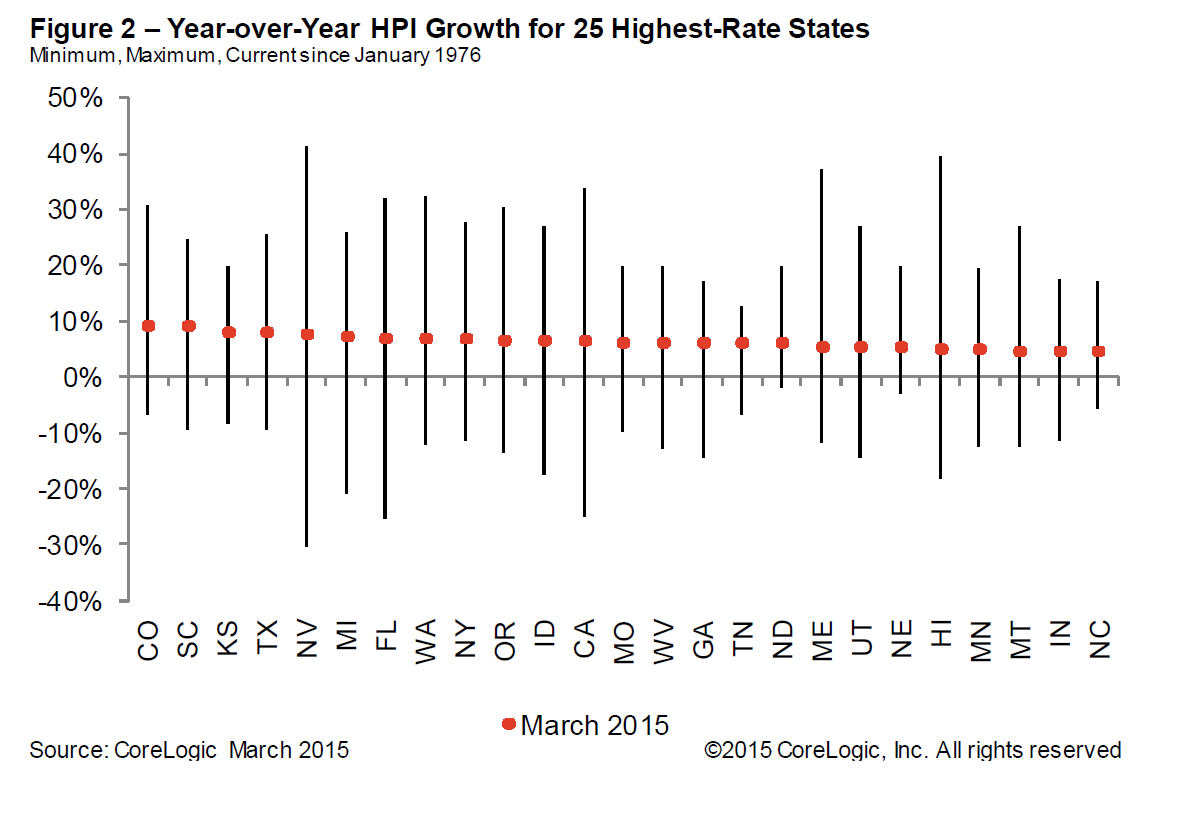
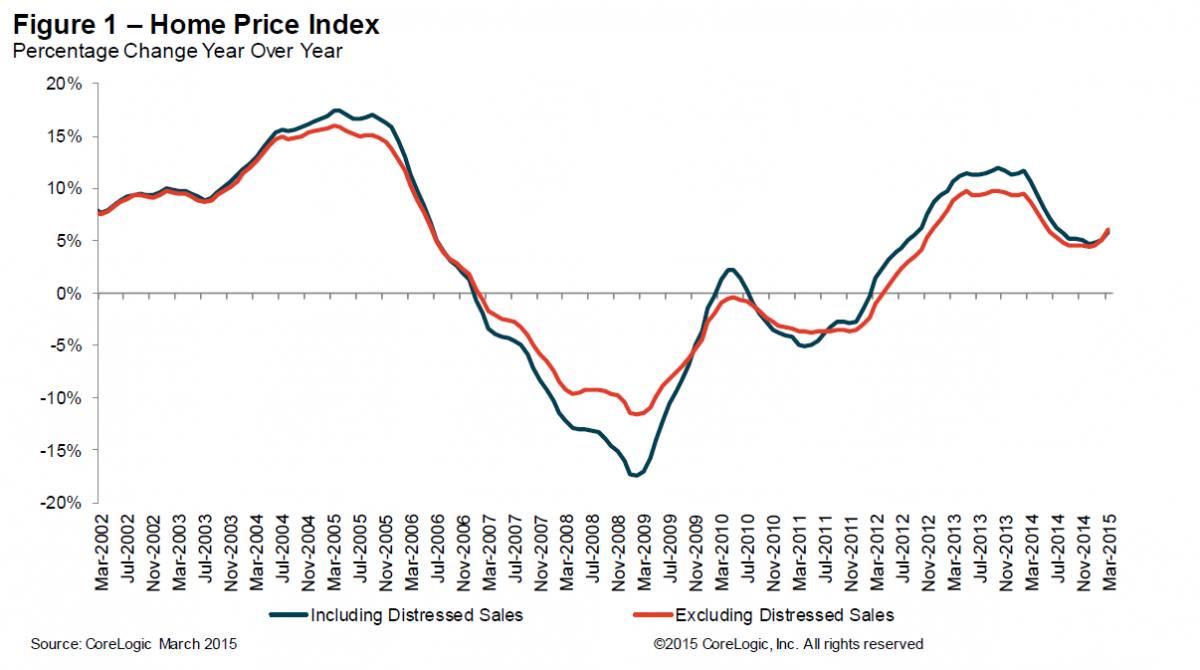
CoreLogic has released its March 2015 CoreLogic Home Price Index (HPI) which shows that home prices nationwide, including distressed sales, increased by 5.9 percent in March 2015 compared with March 2014. This change represents 37 months of consecutive year-over-year increases in home prices nationally. On a month-over-month basis, home prices nationwide, including distressed sales, increased by two percent in March 2015 compared with February 2015. Including distressed sales in March, 27 states plus the District of Columbia, were at or within 10 percent of their peak prices. Seven states, including Colorado, Nebraska, New York, Oklahoma, Tennessee, Texas and Wyoming, reached new home price highs since January 1976 when the CoreLogic HPI started.
Excluding distressed sales, home prices increased by 6.1 percent in March 2015 compared with March 2014 and increased by two percent month over month compared with February 2015. Excluding distressed sales, only New Mexico (0.4 percent) showed year-over-year depreciation in March. Distressed sales include short sales and real estate-owned (REO) transactions.
The CoreLogic HPI Forecast indicates that home prices, including distressed sales, are projected to increase by 0.8 percent month over month from March 2015 to April 2015 and on a year-over-year basis by 5.1 percent from March 2015 to March 2016. Excluding distressed sales, home prices are expected to increase by 0.7 percent month over month from March 2015 to April 2015 and by 4.7 percent year-over-year from March 2015 to March 2016. The CoreLogic HPI Forecast is a projection of home prices using the CoreLogic HPI and other economic variables. Values are derived from state-level forecasts by weighting indices according to the number of owner-occupied households for each state.
“The homes for sale inventory continues to be limited while buyer demand has picked up with low mortgage rates and improving consumer confidence,” said Frank Nothaft, chief economist for CoreLogic. “As a result, there has been continued upward pressure on prices in most markets, with our national monthly index up 2 percent for March 2015 and up approximately six percent from a year ago.”
“All signs are pointing toward continued price appreciation throughout 2015. In fact, the strong month-over-month gain in March may be a harbinger of accelerating price appreciation as we enter the spring selling season,” said Anand Nallathambi, president and CEO of CoreLogic. “Tight inventories, job growth and the inexorable impact of demographics and household formation are pushing price levels in many states, and especially large metropolitan areas like Dallas, Denver, Houston, Seattle and San Francisco, toward record levels.”
Highlights as of March 2015:
►Including distressed sales, the five states with the highest home price appreciation were: Colorado (+9.2 percent), South Carolina (+9.1 percent), Kansas (+8 percent), Texas (+8 percent) and Nevada (+7.6 percent).
►Excluding distressed sales, the five states with the highest home price appreciation were: Kansas (+9.5 percent), Colorado (+8.5 percent), South Carolina (+8.2 percent), Florida (+7.9 percent) and Texas (+7.6 percent).
►Including distressed transactions, the peak-to-current change in the national HPI (from April 2006 to March 2015) was -11 percent. Excluding distressed transactions, the peak-to-current change for the same period was -6.7 percent.
►Including distressed sales, two states and the District of Columbia experienced home price depreciation at the following rates: Connecticut (-0.6 percent), the District of Columbia (-0.2 percent) and Maryland (-0.1 percent).
►The five states with the largest peak-to-current declines, including distressed transactions, were: Nevada (-34.7 percent), Florida (-31.5 percent), Rhode Island (-29 percent), Arizona (-27.4 percent) and Connecticut (-25.5 percent).
►Ninety of the top 100 Core Based Statistical Areas (CBSAs) measured by population showed year-over-year increases in March 2015. The 10 CBSAs that showed year-over-year declines were: Baltimore-Columbia-Towson, Md.; Philadelphia, Pa.; Camden, N.J.; Hartford-West Hartford-East Hartford, Conn.; New Orleans-Metairie, La.; Rochester, N.Y.; Worcester, Mass.-Conn..; Albany-Schenectady-Troy, N.Y.; New Haven-Milford, Conn. and Wilmington, Del.-Md.-N.J.