Advertisement
The Metro With the Highest Home Price Inequality Is …

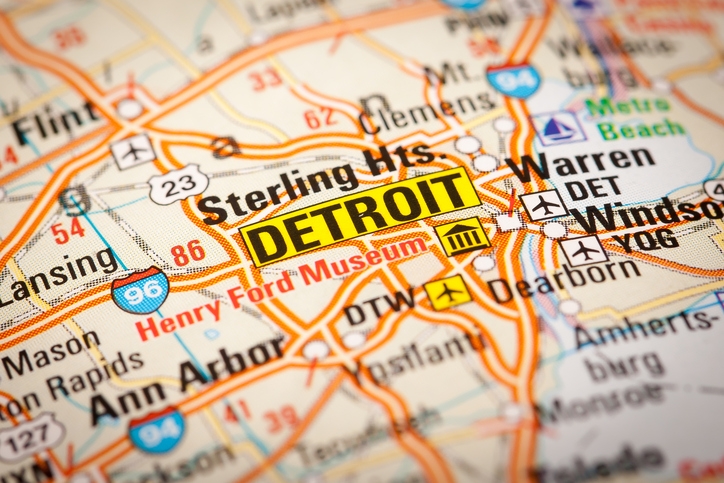
When it comes to home price inequality, Detroit leads the nation, according to a new data analysis released by LendingTree.
In a study of the nation’s 50 largest metro areas, LendingTree used the GINI coefficient to determine inequality levels. The study also considered the values of the 5th and 95th percentile homes, using their ratio to provide a more tangible measure of the topic. While it might be easy to assume that the priciest markets are epicenters for high inequality, the study concluded that the most equal markets were less affordable for borrowers with low incomes. As a result, the expensive San Francisco and San Jose metros ranked 33rd and 41st out of the 50 metros studied for this analysis.
Instead, Detroit—followed by Birmingham, Ala., and Indianapolis—ranked highest for home price inequality, with a level of inequality twice that of the most equal markets. In comparison, Salt Lake City, Portland and Denver have the least home price inequality—the 95th percentile of home values was found to be three times the value of the 5th percentile in these markets, whereas the most unequal markets measured at more than 10 times the value.
“The metros with the most inequality tended to have very low prices for the 5th percentile of home values,” said Tendayi Kapfidze, Chief Economist at LendingTree. “Of the 10 most unequal markets, none had a fifth percentile home value of $100,000 or more, and averaged $48,500. The most equal markets had a $242,100 average value for the 5th percentile of homes.”
Kapfidze added that the World Bank listed the income GINI for the U.S. at 0.415 in 2016, with Detroit as the only metro area to rank above that level, at 0.446. “So, income inequality is greater than home value inequality, a phenomenon also reflected in the fact that wealthier households don’t need to spend as high a portion of their earnings on housing.”
About the author


