Advertisement
Home Affordability at 10-Year Low
Two new data reports offer further evidence that the pursuit of affordable homeownership opportunities has become increasingly complicated.
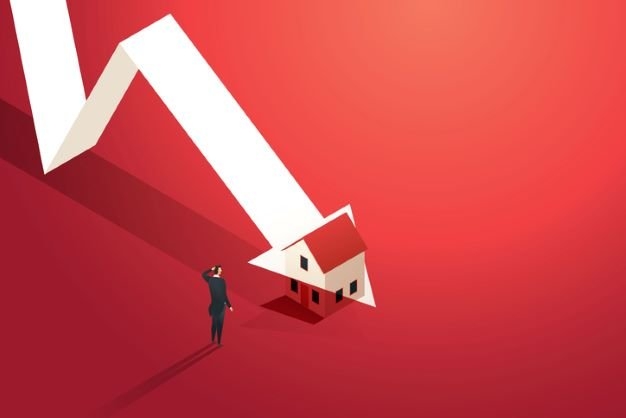
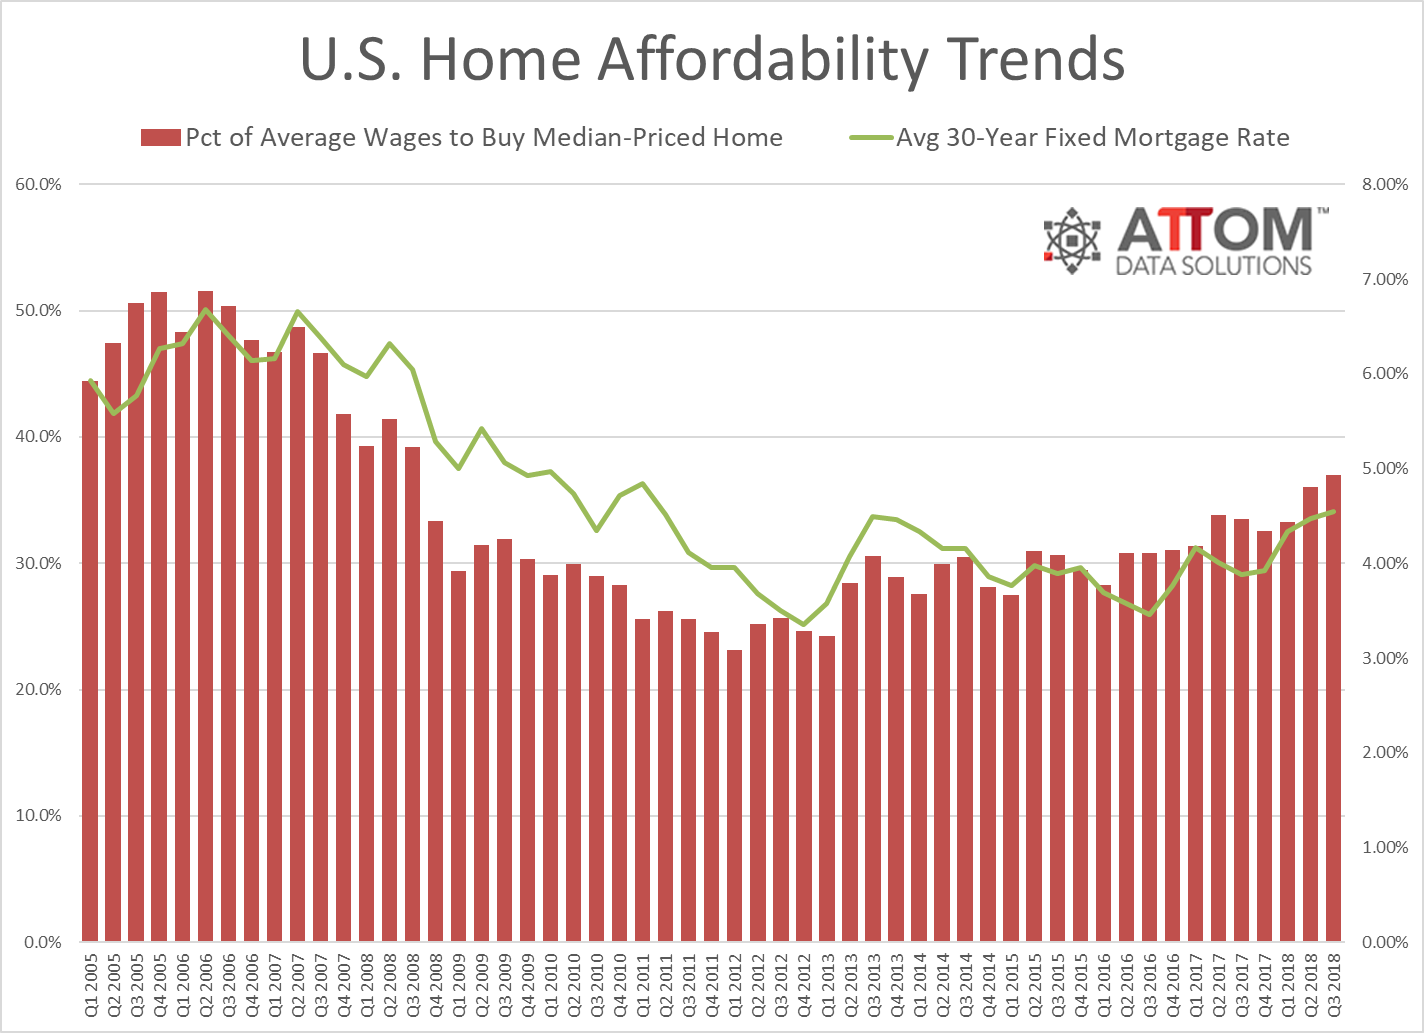
Home prices in the third quarter fell to their lowest affordability rate since the third quarter of 2008, according to new statistics from ATTOM Data Solutions. Using its proprietary home affordability index, ATTOM reported a third quarter index reading of 92, down from a level of 95 in the previous quarter and 102 in the third quarter of 2017.
Among the 440 counties analyzed in for this study, 344—or 78 percent—posted a third quarter affordability reading of below 100. In 69 of the counties, homebuyers would need to make $100,000 or more to buy a median-priced home. Perhaps not surprisingly, the most expensive counties include the five counties in the California Bay Area and three New York City metro area counties.
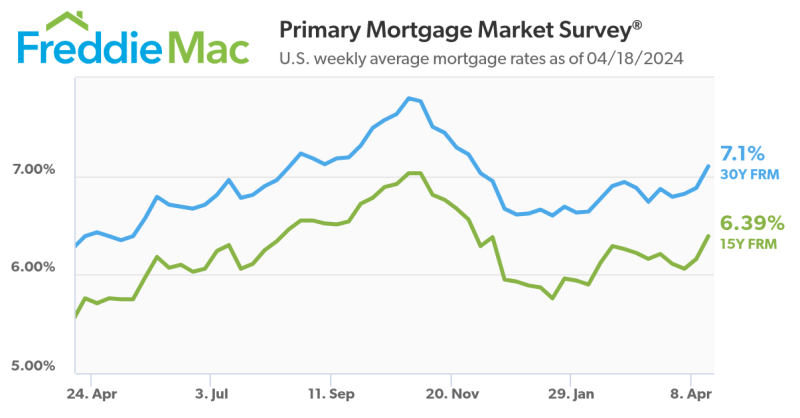
“Rising mortgage rates have pushed home prices to the least affordable level we’ve seen in 10 years, both nationally and at the local level,” said Daren Blomquist, Senior Vice President at ATTOM Data Solutions. “Close to one-third of the U.S. population now lives in counties where buying a median-priced home requires at least $100,000 in annual income based on our analysis of 440 counties with a combined population of 220 million. U.S. Census net migration data shows negative net migration in more than two-thirds of those highest-priced markets, while more than three-quarters of markets requiring annual income less than $100,000 to buy a home posted positive net migration, indicating that home affordability is at least one factor driving recent migration patterns.”
Complicating the lack of affordable homeownership options is the new high values associated with foreclosed properties. Zillow is reporting that the average value of homes that were foreclosed on during the Great Recession were up by 10.3 percent over the past year, compared to the 6.5 percent annual appreciation rate recorded on non-foreclosed homes. Throughout the post-crisis recovery years, foreclosed homes have gained 74.5 percent in value, compared to about 46 percent for all homes.
“While the overall market is facing growing headwinds, homes that were foreclosed upon during the bust are picking up steam, speaking to the enduring appeal of affordability,” said Zillow Senior Economist Aaron Terrazas. “For families who lost their homes during the housing bust and were locked out of the market for several years thereafter, this was a critical lost opportunity.”
About the author


