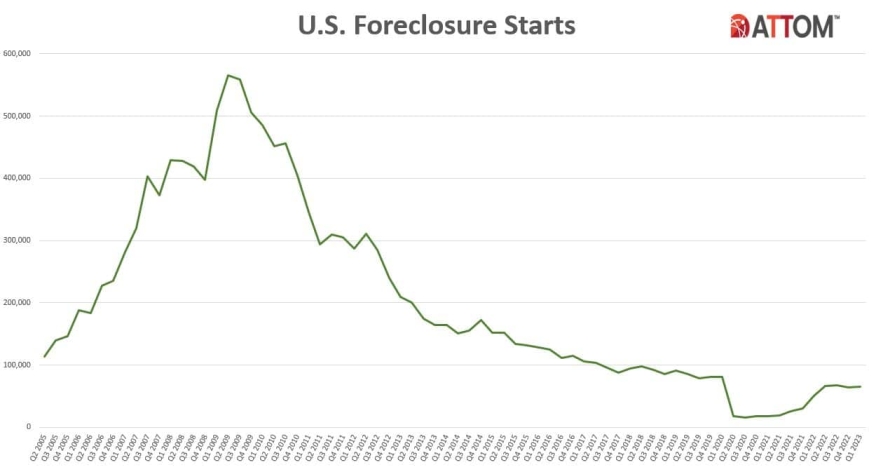
Foreclosure activity in the United States increased in the first quarter of 2023, according to a report released Wednesday by ATTOM, a real estate data curator based in Irvine, Calif.
The Q1 2023 U.S. Foreclosure Market Report shows a total of 95,712 U.S. properties with foreclosure filings in the first quarter, up 6% from the fourth quarter of 2022 and up 22% from a year ago.
“Despite efforts made by government agencies and policymakers to try and reduce foreclosure rates, we are seeing an upward trend in foreclosure activity,” said Rob Barber, CEO at ATTOM. “This unfortunate trend can be attributed to a variety of factors, such as rising unemployment rates, foreclosure filings making their way through the pipeline after two years of government intervention, and other ongoing economic challenges. However, with many homeowners still having significant home equity, that may help in keeping increased levels of foreclosure activity at bay.”
The states with the highest number of foreclosure starts in the first quarter were California, Texas, Florida, New York, and Illinois. The states with the highest foreclosure rates were Illinois, Delaware, New Jersey, Maryland, and Nevada.
The report also found that the average time to foreclose has increased by 12% from the previous quarter. Properties foreclosed in the first quarter of 2023 had been in the foreclosure process an average of 950 days, the highest number of average days to foreclose since the first quarter of 2018. The states with the longest average foreclosure timelines for homes foreclosed in the first quarter were Louisiana, Hawaii, New York, Kentucky, and New Jersey.
Bank repossessions also increased by 8% from the previous quarter. Lenders repossessed 12,518 U.S. properties through foreclosure in the first quarter, up 6% from a year ago and the highest level in three years. The states with the highest number of REOs in the first quarter were Michigan, Illinois, California, Pennsylvania, and New York.
In March 2023, one in every 3,813 properties had a foreclosure filing. The states with the highest foreclosure rates in March were Illinois, Delaware, Nevada, Indiana, and New Jersey. Lenders completed the foreclosure process on 4,791 U.S. properties in March, up 9% from a year ago.
The report also identified major metros with a population of 200,000 or more that had the greatest number of foreclosure starts in the first quarter, including New York, Chicago, Los Angeles, Houston, and Philadelphia. Other major metros with a population of at least 1 million and foreclosure rates in the top 15 highest nationwide included Cleveland; Las Vegas; and Riverside, Calif.