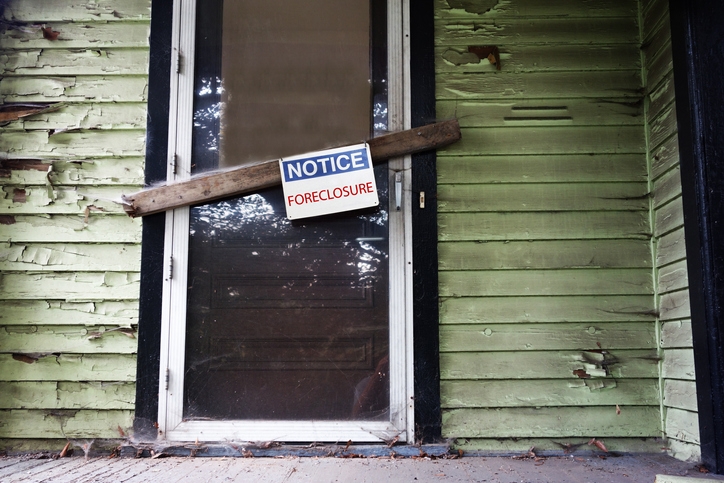
The number of U.S. properties with foreclosure filings increased 2% in January from a month earlier, the 21st consecutive monthly increase, according to a report from ATTOM.
The land, property, and real estate data company on Thursday released its January 2023 U.S. Foreclosure Market Report, which showed there were a total of 31,557 U.S. properties with foreclosure filings — default notices, scheduled auctions or bank repossessions — up 36 percent from a year earlier.
”The uptick in overall foreclosure filings nationwide points toward a trend that may suggest more increased activity is on the horizon as we enter the new year,” said ATTOM CEO Rob Barber. “While both completed foreclosures and foreclosure starts have stalled slightly over the past month, the annual increase in overall activity seen over the past 21 months may indicate a more substantial trend that could continue into 2023.”
REOs Decline YOY
While overall foreclosure activity rose year over year, foreclosure completions fell from last year, the report said. Lenders repossessed 3,896 properties through completed real estate-owned (REO) foreclosures in January 2023, up 6% from December but down 19% from last year — the first annual decrease in completed foreclosures since June 2021, ATTOM said.
States that had at least 100 or more REOs and that saw the greatest annual decreases in January 2023 included: Florida (-53%); Maryland (-23%); Michigan (-22%); New Jersey (-15%); and Texas (-14%).
Counter to the national trend, just three states with 100 or more REOs in January 2023 saw an annual increase: New York (+76%), Pennsylvania (+12%), and California (+4%).
The major metropolitan statistical areas (MSAs) with a population greater than 200,000 that saw the greatest number of REOs included: Detroit (783 REOs); Chicago (206 REOs); New York (149 REOs); Philadelphia (100 REOs); and Riverside, Calif. (66 REOs).
By State
Nationwide, one in every 4,425 housing units had a foreclosure filing in January.
States with the highest foreclosure rates were Delaware (one in every 2,109 housing units); Illinois (one in every 2,279 units); Michigan (one in every 2,617 units); New Jersey (one in every 2,858 units); and Maryland (one in every 2,967 units).
Among the 223 metropolitan statistical areas with a population of at least 200,000, those with the highest foreclosure rates in January 2023 were Fayetteville, N.C. (one in every 1,322 housing units); Bakersfield, Calif. (one in every 1,522 units); Cleveland (one in every 1,557 units); Detroit (one in every 1,575 units); and Laredo, Texas (one in every 1,953 units).
Other than Cleveland and Detroit, among the metropolitan areas with a population greater than 1 million, those with the worst foreclosure rates in January 2023 included: Chicago (one in every 2,074 units); Riverside, Calif. (one in every 2,123 units); and Las Vegas (one in every 2,341 units).
Foreclosure Starts
Lenders started the foreclosure process on 20,752 U.S. properties in January 2023, down 1% from last month but up 75% from a year ago.
The states with the greatest number of foreclosures starts in January included: California (2,513); Texas (2,136); Florida (1,725); New York (1,375); and Illinois (1,309).
The major metropolitan statistical areas with a population of at least 200,000 that had the greatest number of foreclosure starts in January included: New York (1,370); Chicago (1,156); Los Angeles (774); Houston (629); and Philadelphia (612).
ATTOM’s U.S. Foreclosure Market Report provides a count of the total number of properties with at least one foreclosure filing entered into its data warehouse during the month and quarter. Some foreclosure filings may have been recorded in the previous quarter. Data is collected from more than 3,000 counties nationwide, and those counties account for more than 99% of the U.S. population.
ATTOM incorporates documents filed in all three phases of foreclosure: Default — including notice of default (NOD) and lis pendens (LIS); Auction — notice of trustee sale and notice of foreclosure sale (NTS & NFS); and real estate-owned (REO) properties (that have been foreclosed on and repurchased by a bank). For the annual, midyear, and quarterly reports, if more than one type of foreclosure document is received for a property during the timeframe, only the most recent filing is counted in the report.