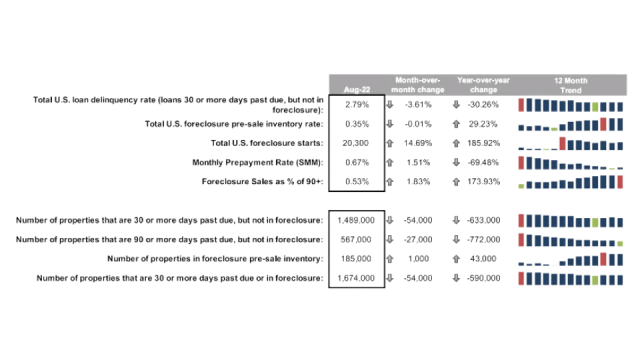
Black Knight’s first look at August 2022 month-end mortgage performance statistics shows the total U.S. loan delinquency rate (loans 30 days or more past due, but not in foreclosure) fell 3.6% in August to 2.79%, just four basis points above May’s 2022 record low. Year-over-year change in loan delinquency is down 30.26%.
Improvement was broad based with the number of borrowers a single payment past due fell by 4% and those 90 or more days delinquent down 4.5%. After dropping steadily over recent months, cure activity also improved in August with 62K seriously delinquent loans curing to current status, up from 58K in July.
The month’s 20.3K foreclosure starts represent a 15% jump in activity from July but remain 44% below August 2019 levels. Likewise, starts were initiated on 3.4% of serious delinquencies, up slightly from July but still less than half the rate seen in the years leading up to the pandemic.
Prepays (SMM) edged up 1.5% for the month, due to calendar-related effects, but are still down by 69% year-over-year as rising rates continue to put downward pressure on both purchase and refinance lending.
Foreclosure sales as a percentage of 90 days or more delinquent were up 0.53%, increasing 1.83% month-over-month and down 173.93% year-over-year.
The total number of properties that are 30 or more days past due, but not in foreclosure, is 567,000, dropping 27,000 month-over-month and 772,000 year-over-year. While the number of properties in foreclosure pre-sale is 185,000, increasing by 1,000 over the previous month and improving by 43,000 from last year.
The total number of properties that are 30 or more days past due or in foreclosure is 1,674,000, down by 54,000 month-over-month and down by 590,000 year-over-year.
Black Knight listed the top five and bottom five states in various stages of delinquency by non-current percentages. Non-current totals combine foreclosures and delinquencies as a percent of active loans in that state.
Top 5 States by Non-Current Percentage
Mississippi: 6.28 %
Louisiana: 5.63 %
Oklahoma: 4.71 %
Alabama: 4.62 %
West Virginia: 4.43 %
Bottom 5 States by Non-Current Percentage
Oregon: 1.98 %
California: 1.81 %
Colorado: 1.77 %
Idaho: 1.72 %
Washington: 1.70 %
Top 5 States by 90+ Days Delinquent Percentage
Mississippi: 2.37 %
Louisiana: 2.02 %
Alaska: 1.72 %
Alabama: 1.68 %
Arkansas: 1.55 %
Top 5 States by 6-Month Change in Non-Current Percentage
Hawaii: -27.50 %
Vermont: -26.11 %
New York: -22.48 %
California: -21.75 %
Utah: -20.52 %
Bottom 5 States by 6-Month in Non-Current Percentage
Iowa: -4.32 %
South Dakota: -6.19 %
Illinois: -7.77 %
Alaska: -8.34 %
Oklahoma: -8.43 %