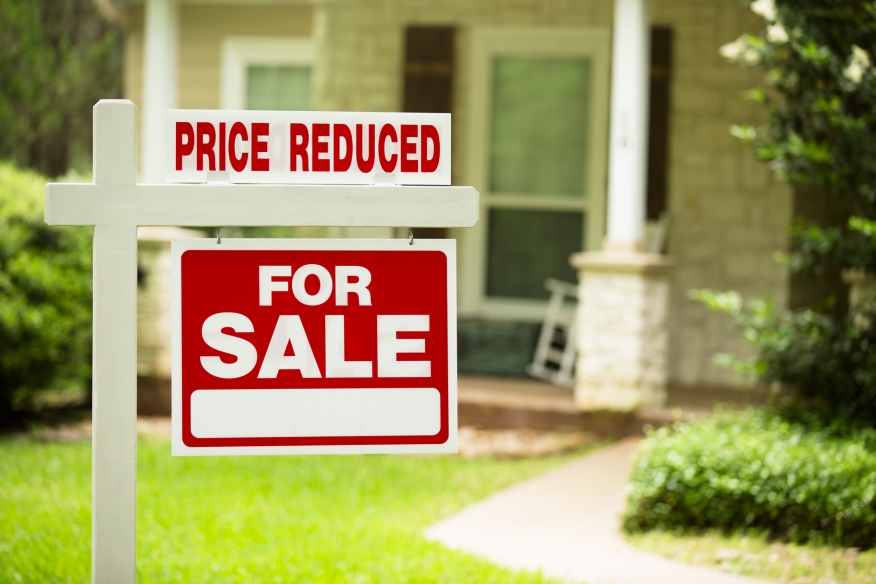
Is the real estate party over? For home sellers it might be, since price reductions are up 69% from last May across the nation. It seems as if May might be the turning point in the red-hot real estate market that’s been scalding homebuyers the past few years.
The number of listings that hit the market last month increased for the first time since June 2019, according to a new report from Realtor.com. May home shoppers had 8% more active listings to choose from compared to the same month last year.
Newly listed homes were up 6.3% nationally compared to a year ago, and up 4.6% for large metros over the past year. However, sellers still listed at rates 6.4% lower than typical 2017 to 2019 levels prior to the pandemic.
“We’re seeing more homeowners decide to sell,” says Danielle Hale, chief economist of Realtor.com. “Buyers can expect more inventory going forward, more homes to choose from.”
Still, the inventory of active listings was down 48.5% compared to May 2020 in the early days of the COVID-19 pandemic. In other words, there are still only half as many homes available.
Although rates are straining buyers and sellers, housing remains expensive and fast-paced, with the median asking price at a new high while time on the market is at a new low. The May national median listing price for active listings was $447,000, up 17.6% compared to last year and up 35.4% compared to May 2020. The median listing price for a typical 2,000 square-foot single family home rose 19.3% compared to last year, also an acceleration from 17.3% last month.
In large metros, median listing prices grew by 13% compared to last year, on average. Nationwide, the typical home spent 31 days on the market in May, down 6 days from the same time last year and down 40 days from May 2020.
The number of pending listings on a typical day — listings at various stages of the selling process that are not yet sold — has declined by 12.6% compared to last May, indicating that a moderation in demand is also softening the rate of turnover in inventory. This is a further deceleration from the 8.7% annual decline Realtor.com reported for April. For homebuyers still actively searching for a home, less competition and more seller activity will provide some relief.
An acceleration in listing prices typically signals strong demand and/or limited supply. However, given the growing supply of home and softness in sales and pending listings, the median listing price continuing to accelerate compared to last year could be attributed to an increasing share of newly listed larger homes and sellers not yet adjusting to market conditions.
The share of newly listed smaller homes (up to 1,750 square feet) declined from 47.3% last May to 45.7% this May, while the share of homes larger than 1,750 square feet increased from 52.7% to 54.3%. Because of these newly listed homes, larger, more expensive homes make up a bigger share of what’s for-sale this year than last year.
In addition, while the median listing price of active listings accelerated, the median list price of listings in pending status — those homes for which the seller has already accepted a buyer’s offer to purchase — actually decelerated, from a year-over-year rate of 17.2% in April to a growth rate of 16.2% in May. This indicates that the homes buyers choose to buy tend to be less expensive, and also suggests that sellers have not fully adjusted their expectations to market conditions.
There are signs, however, of this adjustment beginning to occur. The share of homes having their price reduced increased from 6.2% last May to 10.5% this year, but still remains 6.2 percentage points below typical 2017-19 levels. All but one of the largest 50 metros saw an increasing share of price reductions in May, up from 40 last month.