The number of mortgage loans in forbearance continued to decline in April, according to the latest survey by the Mortgage Bankers Association (MBA).
MBA’s monthly Loan Monitoring Survey covers the period from April 1-30, and represents 65% of the first-mortgage servicing market (32.7 million loans).
The survey found that, as of April 30, the total number of loans now in forbearance was 0.51% of servicers’ portfolio volume, down 4 basis points from 0.55% in March.
According to MBA’s estimate, 255,000 homeowners are in forbearance plans. Since April 2020, mortgage servicers have provided forbearance to approximately 7.8 million borrowers, it said.
In April, the share of Fannie Mae and Freddie Mac loans in forbearance decreased 2 basis points to 0.24%, while Ginnie Mae loans in forbearance decreased 7 basis points to 1.11%, MBA said. The forbearance share for portfolio loans and private-label securities (PLS) decreased 7 basis points to 0.61%, it said.
'Some deterioration'
“While the number of loans in forbearance continues to dwindle, there was some deterioration in the performance of post-forbearance workouts,” said Marina Walsh, CMB, MBA’s vice president of industry analysis. “About three out of four borrowers are remaining current on their post-forbearance workouts, but this is down from the average of four out of five borrowers that was relatively consistent in 2022 and into 2023.”
Overall servicing portfolios remain healthy, Walsh said, noting that “some of the worsening monthly performance can be attributed to seasonal factors, such as tax refunds that pushed up the March results and then normalized in April.”
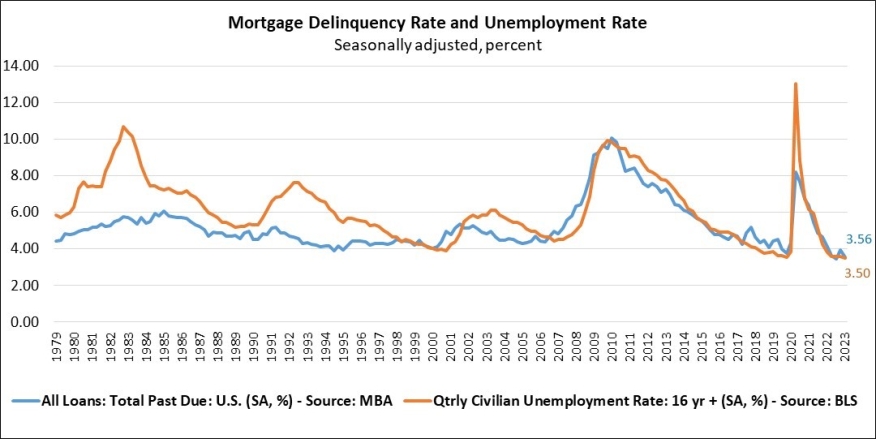
She said the MBA’s forecast calls for “an economic slowdown and an increase in unemployment later this year and into 2024, which will impact loan performance.”
Other Survey Highlights:
- Loans in forbearance as a share of servicing portfolio volume as of April 30:
- Total: 0.51% (previous month: 0.55%)
- Independent Mortgage Banks (IMBs): 0.68% (previous month: 0.74%)
- Depositories: 0.35% (previous month: 0.36%)
- By stage, 34.4% of total loans in forbearance are in the initial forbearance plan stage, while 53.2% are in a forbearance extension. The remaining 12.4% are forbearance re-entries, including re-entries with extensions.
- Of the cumulative forbearance exits for the period from June 1, 2020, through April 30, 2023, at the time of forbearance exit:
- 29.6% resulted in a loan deferral/partial claim.
- 18% represented borrowers who continued to make their monthly payments during their forbearance period.
- 17.7% represented borrowers who did not make all of their monthly payments and exited forbearance without a loss mitigation plan in place yet.
- 16.1% resulted in a loan modification or trial loan modification.
- 10.9% resulted in reinstatements, in which past-due amounts are paid back when exiting forbearance.
- 6.5% resulted in loans paid off through either a refinance or by selling the home.
- The remaining 1.2% resulted in repayment plans, short sales, deed-in-lieus or other reasons.
- Total loans serviced that were current (not delinquent or in foreclosure) as a percent of servicing portfolio volume decreased to 95.89% in April from 96.35% in March (on a non-seasonally adjusted basis).
- The five states with the highest share of loans that were current as a percent of servicing portfolio: Washington, Colorado, Idaho, Oregon, and California
- The five states with the lowest share of loans that were current as a percent of servicing portfolio: Louisiana, Mississippi, New York, Indiana, and Alabama.
- Total completed loan workouts from 2020 onward (repayment plans, loan deferrals/partial claims, loan modifications) that were current as a percent of total completed workouts decreased to 74.39% in April from 76.7% in March.