Homebuyers saw April’s national median mortgage payment increase to $2,256 in April from $2,201 the previous month.
The Mortgage Bankers Association (MBA) released the latest results of its Purchase Applications Payment Index (PAPI) Thursday, with an increase indicative of a higher mortgage payment-to-income ratio.
“Homebuyer affordability conditions declined further as mortgage rates remained above seven percent in April, sidelining many prospective buyers from entering the housing market,” said MBA’s Associate Vice President of Housing Economics, and Executive Director of the Research Institute for Housing America, Edward Seiler. “In addition to lower mortgage rates, more housing inventory is desperately needed in markets throughout the country this summer to alleviate these tough affordability conditions.”
The increase in the PAPI can be attributed to increasing application loan amounts, rising mortgage rates, or a decrease in earnings.
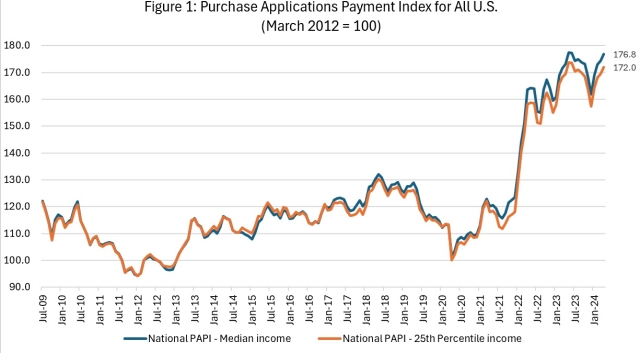
Nationwide, the index rose 1.5% to 176.8 in April from 174.2 in March. Median earnings were up 4.6% compared to one year ago, and while payments increased 6.8%, the strong earnings growth means that the PAPI is up 2.1% on an annual basis, according to the MBA. For borrowers applying for lower-payment mortgages (the 25th percentile), the national mortgage payment increased to $1,537 in April from $1,488 in March.
MBA’s Builder Application Survey showed the median payment for purchase mortgages increased to $2,604 in April from $2,556 in March.
The national median mortgage payment was $2,256 in April—up $55 from March. It is up $144 from one year ago, equal to a 6.8% increase. The national median mortgage payment for FHA loan applicants was $1,955 in April, up from $1,898 in March and up from $1,750 in April 2023.
The national median mortgage payment for conventional loan applicants was $2,271, up from $2,222 in March and up from $2,170 in April 2023.
The top five states with the highest PAPI were: Idaho (267.2), Nevada (264.9), Arizona (236.4), Florida (227.4), and Rhode Island (224.8).
The top five states with the lowest PAPI were: Alaska (131.6), Louisiana (134.1), Connecticut (134.2), New York (139.1), and Washington, D.C. (141.2).
Homebuyer affordability decreased for Black households, with the national PAPI increasing from 180.4 in March to 183.1 in April.
Homebuyer affordability decreased for Hispanic households, with the national PAPI increasing from 166.4 in March to 168.9 in April.
Homebuyer affordability decreased for White households, with the national PAPI increasing from 176.8 in March to 179.5 in April.