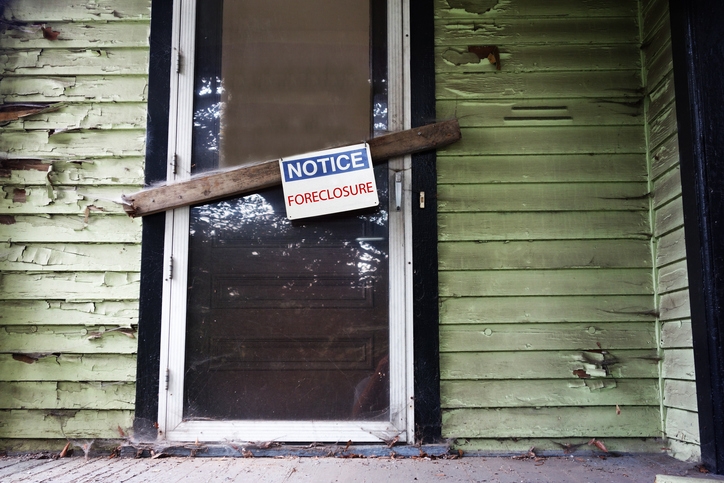
The number of vacant homes in the U.S. remained steady in the third quarter of 2025, even as so-called “zombie” foreclosures inched higher, according to ATTOM’s latest Vacant Property and Zombie Foreclosure Report.
ATTOM found that about 1.39 million residential properties—roughly 1.3% of all U.S. homes—were vacant in Q3, a rate that has held consistent for more than three years amid sustained housing demand. Within that pool, 222,318 homes were in the foreclosure process. Of those, 7,519 properties, or 3.38%, were categorized as zombie foreclosures—abandoned by their owners while still working through the legal process. That share is up slightly from 3.30% in the second quarter and 3.14% a year ago.
“Vacant and zombie homes can hurt the value of surrounding properties and start a negative spiral in a local housing market,” said Rob Barber, CEO of ATTOM. “While we’ve seen the rate of zombie homes tick up a tiny bit this quarter, the overall rate of vacant homes and homes in the foreclosure process has remained remarkably steady.”
State and Metro-Level Trends
The report showed modest quarter-to-quarter shifts in zombie foreclosures across states, with increases in 23 states and declines in 23 others plus Washington, D.C. Most changes were in the single- or low double-digits. Four states saw no change.
Year-over-year, the sharpest increases in zombie rates occurred in:
- Colorado: up 115%, from 27 to 58 zombie properties
- Washington: up 114%, from 29 to 62
- Iowa: up 84%, from 64 to 118
- North Carolina: up 80%, from 50 to 90
- Oklahoma: up 72%, from 43 to 74
Meanwhile, notable declines were recorded in Georgia (-25%), New Jersey (-21%), Illinois (-17%), and New York (-10%).
Vacancy rates varied widely by region. Oklahoma (2.4%), Kansas (2.3%), and Alabama (2.2%) posted the highest overall vacancy rates, while New Hampshire (0.35%), Vermont (0.41%), and New Jersey (0.51%) had the lowest.
Large metro areas generally outperformed the national average, with 57% showing zombie foreclosure rates below 3.38%. Wichita, Kansas (12.7%) had the highest share of zombie foreclosures among major metros, followed by Peoria, Illinois (12.3%) and Youngstown, Ohio (10.1%). Nashville, Tennessee recorded none.
Investor-Owned Properties
The report also highlighted the role of investors. Of the 24.9 million investor-owned homes nationwide, 3.6% (882,336) were vacant. Indiana (7.2%), Illinois (6.1%), and Oklahoma (5.9%) had the highest vacancy rates for investor-owned homes, while New Hampshire (0.9%) and Vermont (1%) ranked lowest.
Despite localized concerns, Barber noted that most housing markets are absorbing vacant properties quickly. “While there remain some markets with worryingly high rates of vacancies, as a whole it appears that the nation’s buyers are quickly filling homes that become available,” he said.