Advertisement
Mortgage Economic Review August 2020

BY MARK PAOLETTI | SPECIAL TO NATIONAL MORTGAGE PROFESSIONAL
While social unrest dominated the news in August, the data on the economic recovery is encouraging. Consumer Spending and Employment continue to increase. The COVID-19 death rate continues to decline. The most encouraging news is hidden in the recent housing market data, especially the new home sector.
Every robust economic recovery in the past has always been led by a strong housing market with new home construction. The Trickle-Down Effect on the Economy from New Construction is huge: more workers employed to build homes, more roads built to get to the homes, more cars sold to travel to the homes, more furniture sold to decorate the homes, more kids born to fill the homes, more schools built to teach the kids, more retail stores built to provide shopping for the homeowners, etc. The old adage is still true: As the housing market goes - so goes the economy.
Key Economic Data and Events in August 2020
- Stock prices set all-time record highs in the S&P 500 and NASDAQ indexes
- Inflation increasing as the both CPI and PPI rose 0.6% in July
- Several western states are baking in an unprecedented heatwave and subsequent wildfires
- Fannie Mae & Freddie Mac extended foreclosure and eviction moratorium until 2021
- Fannie & Freddie announced a 50 bp "Adverse Market Fee" on refinances after Dec 1
- President Trump issued executive orders to help unemployed workers after Congress recessed without a new stimulus package
Interest Rates and Fed Watch
Two big events in August for the Fed were: the release of the last FOMC Minutes and the Economic Symposium (virtually) at Jackson Hole. The FOMC Minutes had no surprises. They reinforced the Fed's "accommodative" monetary policy to continue for years and their tolerance for elevated Inflation during the recovery.
The Fed has had a 2.0% inflation target for the last decade, but during this recovery, the Fed will tolerate higher inflation. The combination of massive monetary and fiscal stimulus saved the economy from a meltdown but created potential inflation problems that the Fed has to deal with down the road. Maintaining the recovery and containing inflation in 2021 will be a tricky job. The next FOMC meeting is Sept. 15 and 16.
Housing Market Data Released in August 2020
Home sales plummeted during the COVID lock down, but came roaring back. Diving deeper into August housing data reveals some interesting changes in homebuyer psychology and motivation. For many years affordability and saving a down payment were two major hurdles for homebuyers. Low interest rates helped affordability, and unexpectedly, the COVID lockdown helped with the down payment. During the lockdown, many people saved a lot of money - enough for a down payment.
Their priorities also changed to a focus on safety, security, and control. Homebuyers want control over their safety, security, and environment that they can't get as renters. They want to control where they live, how much space they live in, and how that space is configured. If people have to work from home, they want more room to do it comfortably. These psychological shifts are boosting migration to the suburbs and a surge in new home construction. Many homebuyers also discovered that it is often cheaper to own a spacious home in the suburbs than renting a small apartment in the city.
- Existing Home Sales (closed deals in July) rose 24.7% to an annual rate of 5,860,000 homes, up 8.7% in the last 12 months. The median price for all types of homes is $304,100 - up 8.5% from a year ago. The median single-family home price is $307,800 and $270,100 for a condo. First-time buyers were 34%, investors 15%, cash buyers 16%. Homes were on the market for an average of 22 days, and 68% were on the market for less than a month. Currently, 1,500,000 homes are for sale, down 21.1% from 1,900,000 units a year ago.
- New Home Sales (signed contracts in July) rose 13.9 % to a seasonally adjusted annual rate of 901,000 homes - up 36.3% year over year. The median new home price rose 7.2% year over year to $330,600, and the average is $391,300. There are 299,000 new homes for sale, down from 307,000 the prior month, which is a four-month supply.
- Pending Home Sales Index (signed contracts in July) rose 5.9%, up 15.5% year over year.
- Building Permits (issued in July) rose 18.8% to a seasonally adjusted annual rate of 1,495,000 units - up 9.4% year over year. Single-family permits rose 17.0% to an annual pace of 983,000 homes, up 15.5% year over year.
- Housing Starts (excavation began in July) rose 22.6% to an annual adjusted rate of 1,496,000 units - up 23.4% year over year. Single-family starts rose 8.2% to 940,000 homes - up 7.4% in the last 12 months.
- Housing Completions (completed in July) rose 3.6% to an annual adjusted rate of 1,280,000 units - up 1.7% year over year. Single-family completions fell 1.8% to 909,000 homes - down 0.4% in the last 12 months.
- S&P/Case-Shiller 20 City Composite Home Price Index rose 0.2% in June, up 3.5% year over year.
- FHFA Home Price Index rose 0.9% in June, now up 5.7% year over year.
Labor Market Economic Data Released in August 2020
The economy added 1,763,000 jobs in July, and the unemployment rate fell to 10.2% from 11.1%. This latest jobs data shows the economy continues to recover, albeit at a slower pace than the previous two months. The economy has added 9,300,000 jobs in May, June, and July.
Keep in mind that COVID wiped out 22,200,000 jobs in March and April. To reach the halfway point back to pre-COVID employment, we need to add 11,000,000 jobs. So far, 9,300,000 jobs are back with another 12,900,000 jobs to go before we hit pre-COVID employment levels. Many economists expect that will take five to seven years. Just about every sector of the labor market added jobs. Hospitality and retail had big gains as restaurants and stores re-opened.
- The economy added 1,763,000 Jobs in July
- The unemployment rate fell to 10.2% in July from 11.1% the previous month
- The labor force participation rate fell to 61.4% in July from 61.5% the previous month
- The average hourly wage rose 0.2% in July, up 4.8% year over year
Inflation Economic Data Released in August 2020
Here is the reality when it comes to Inflation: Get Used To It. At this point in the recovery cycle, increased inflation isn't bad news. It's actually good news because it reflects increased demand from consumers. Since our economy is 70% consumer driven, we need consumers to spend money, or the economy won't recover.
The Federal Reserve and Congress flooded the economy with massive amounts of money and spending during the pandemic. The stimulus saved the economy from a meltdown. It had to be done, but there will be a price to pay. That price will be inflation. Consider it a small price. Inflation will be with us for a while. The Fed has already adjusted its tolerance for inflation, and now consumers will have to get used to higher prices over the next few years.
- CPI rose 0.6%, up 1.0% in the last 12 months
- Core CPI (ex-food & energy) rose 0.6%, up 1.6% in the last 12 months
- PPI rose 0.6%, down 0.4% in the last 12 months
- Core PPI (ex-food & energy) rose 0.5%, up 0.3% in the last 12 months
GDP Economic Data Released in August 2020
The Revised Estimate of 2nd Quarter 2020 GDP showed the economy contracted by 31.7%. This updated look at the 2nd quarter contraction is a little better than the first estimate of 32.9%. The 2nd quarter was the height of the COVID lockdown. It's safe to say that COVID wiped out a third of the economy in the 2nd quarter. We'll get one more crack at refining the 2nd Quarter GDP data in September, and then we'll get the first glimpse of 3rd Quarter GDP numbers - when the economy is recovering.
Consumer Economic Data Released in August 2020
Retail sales rose 1.2% in July. With this new data, retail sales are now above pre-COVID levels. This data disappointed many economists when compared to June's retail sales, which jumped 8.4%. The good news is that consumers continued to increase their spending, but at a slower pace than May and June.
Out of the 13 retail categories, nine increased with electronics and appliances leading the pack jumping 22.9%, Clothing (+ 5.0%), Gas Stations, (+ 6.2%), Health Stores (+3.6%) Restaurants (+ 0.5%). There was softness in Auto Sales (- 1.2%), Sporting Goods (-5.0%), and Building Materials (-2.9%), which depressed the data.
- Retail Sales rose 1.2% during July, now up 2.7% in the last 12 months
- Consumer Confidence Index fell to 84.8 from 92.6 the previous month
- Consumer Sentiment Index (U of M) rose to 74.1 from 72.5 the previous month
Energy, International, and Things You May Have Missed
Oil Prices hit a five-month high due to Hurricane Laura disrupting refineries in the south.
- WTI Crude (West Texas Intermediate) is trading around $43/barrel.
- North Sea Brent Crude is trading around $46/barrel.
- The U.S. House of Representatives convened an emergency session to pass a bailout package for the post office.
- Soft commodity prices like sugar, cocoa, coffee, are rising as the global economy recovers.
- UK GDP fell 20.4% in the 2nd quarter - the hardest hit among developed countries.
- Brexit deadline fast approaching with only seven weeks left for the UK and EU to reach a deal.
- Auto sales in China rose 14.9% year over year as people avoid mass transit.
- US-China trade talks were canceled until the global economy has recovered more.
The Mortgage Economic Review is a summary of Key Economic Data that influences the Mortgage and Real Estate Industries. It is a quick read that helps Mortgage Professionals stay updated on important Economic Information that affects their industry. Feel free to share this with friends and colleagues in the Mortgage and Real Estate industries. If you would like this Mortgage Economic Review emailed to you at the beginning of every month, click here. The Mortgage Economic Calendar for each month is available here.
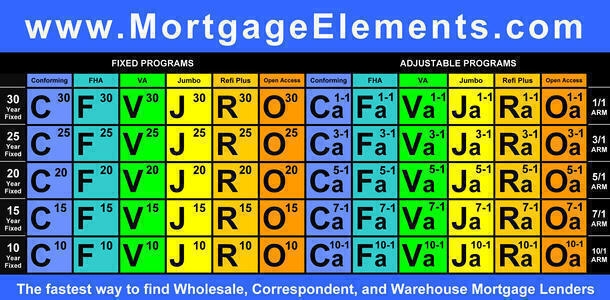
Visit MortgageElements.com and use the Mortgage Periodic Table to explore over 300 Wholesale, Correspondent, and Warehouse Mortgage Lenders from one website. You'll discover new lending opportunities - it costs nothing to use and is one of the industry's largest databases of TPO Mortgage Lenders.
The Mortgage Economic Review is for informational and educational purposes only and should not be construed as investment, legal, financial, or mortgage advice. The information is gathered from sources believed to be credible; some are opinion based and editorial in nature. Mortgage Elements Inc does not guarantee or warrant its accuracy or completeness, and there is no guarantee it is without errors. This newsletter is created for use by Mortgage and Real Estate Professionals and is not an advertisement to extend credit or solicit mortgage originations. © Copyright 2020 Mark Paoletti, Mortgage Elements Inc, All Rights Reserved.
About the author


