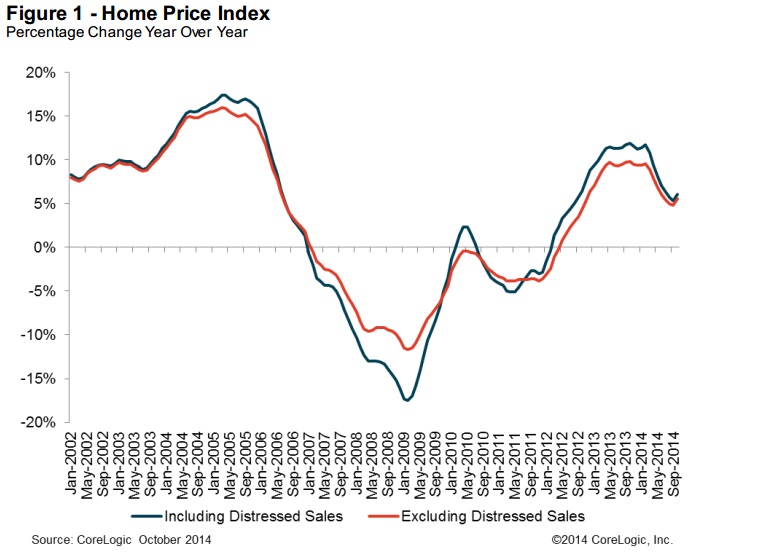
CoreLogic has released its October CoreLogic Home Price Index (HPI) report, which found that home prices nationwide, including distressed sales, increased 6.1 percent in October 2014 compared to October 2013. This change represents 32 months of consecutive year-over-year increases in home prices nationally. On a month-over-month basis, home prices nationwide, including distressed sales, rose by 0.5 percent in October 2014 compared to September 2014.
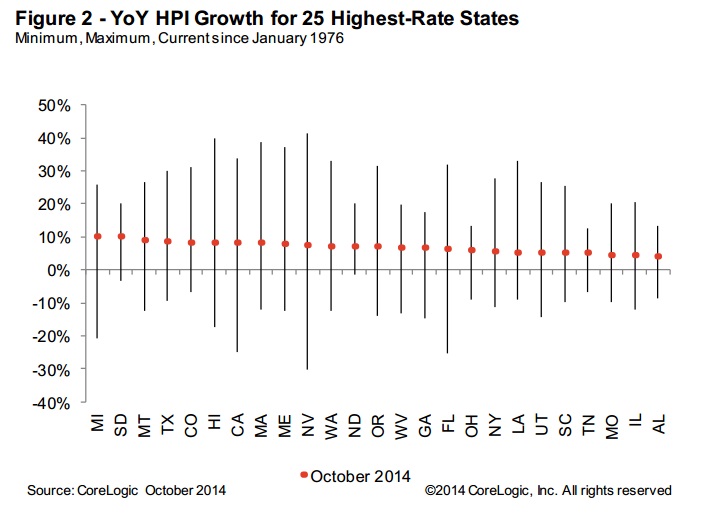
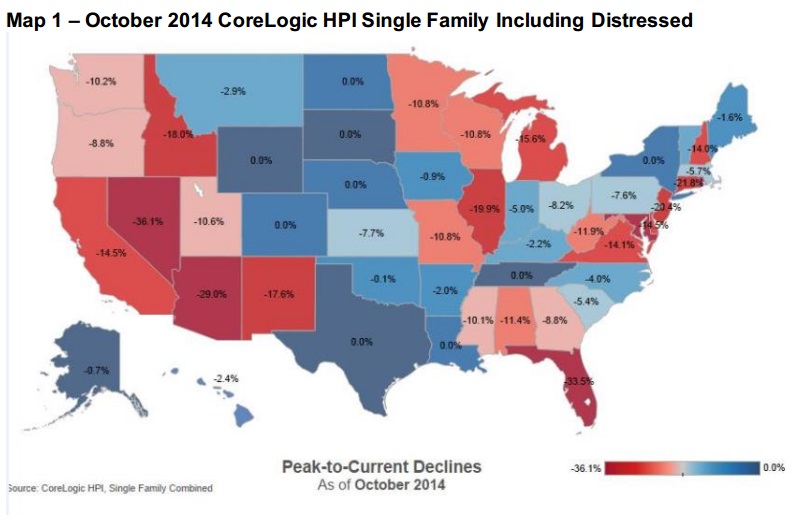
At the state level, including distressed sales, all states showed year-over-year home price appreciation in October. Twenty-seven states and the District of Columbia were at or within 10 percent of their home price peak. The HPI reached new highs in a total of nine states: Colorado, Louisiana, Nebraska, New York, North Dakota, South Dakota, Tennessee, Texas and Wyoming.
Excluding distressed sales, home prices nationally increased 5.6 percent in October 2014 compared to October 2013 and 0.6 percent month over month compared to September 2014. Also excluding distressed sales, 49 states and the District of Columbia showed year-over-year home price appreciation in October, with Mississippi being the only state to experience a year-over-year decline (-1.2 percent). Distressed sales include short sales and real estate-owned (REO) transactions.
The CoreLogic HPI Forecast indicates that home prices, including distressed sales, are projected to increase 0.2 percent month over month from October 2014 to November 2014 and, on a year-over-year basis, by 5.1 percent from October 2014 to October 2015. Excluding distressed sales, home prices are expected to rise 0.2 percent month over month from October 2014 to November 2014 and by 4.7 percent year over year from October 2014 to October 2015. The CoreLogic HPI Forecast is a monthly projection of home prices using the CoreLogic HPI and other economic variables. Values are derived from state-level forecasts by weighting indices according to the number of owner-occupied households for each state.
“Home price growth is moderating as we head into the late fall and is currently running at half the pace it was in the spring of 2014,” said Sam Khater, deputy chief economist at CoreLogic. “However, there are still pockets of strength, especially in several Texas markets, as well as Seattle, Denver and other markets with strong economic fundamentals.”
“The gradual recovery of the housing market continues to be propelled by improving employment, more buyer and seller confidence, continued low rates and, in certain parts of the country, investor demand. The continued actual and projected rise in home prices confirms that fact,” said Anand Nallathambi, president and CEO of CoreLogic. “Based on our projections, home process in over half the country will have reached or surpassed levels last seen at the height of the housing bubble sometime in mid-2015.”
Highlights as of October 2014:
►Including distressed sales, the five states with the highest home price appreciation were: Michigan (+10.5 percent), South Dakota (+10.4 percent), Montana (+9.1 percent), Texas (+8.7 percent) and Colorado (+8.6 percent).
►Excluding distressed sales, the five states with the highest home price appreciation were: South Dakota (+10.4 percent), Massachusetts (+9.7 percent), Maine (+8.4 percent), Texas (+8.1 percent) and Michigan (+8.0 percent).
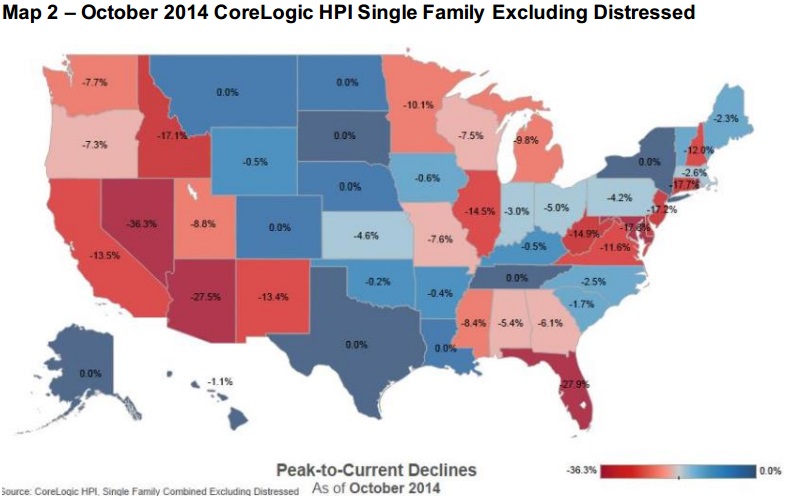
►Including distressed transactions, the peak-to-current change in the national HPI (from April 2006 to October 2014) was -12.4 percent. Excluding distressed transactions, the peak-to-current change in the HPI for the same period was -8.9 percent.
►The five states with the largest peak-to-current declines, including distressed transactions, were: Nevada (-36.1 percent), Florida (-33.5 percent), Arizona (-29.0 percent), Rhode Island (-28.3 percent) and Maryland (-21.9 percent).
►Including distressed sales, the U.S. has experienced 32 consecutive months of year-over-year increases; however, the national average is no longer posting double-digit increases.
►Ninety-four of the top 100 Core Based Statistical Areas (CBSAs) measured by population showed year-over-year increases in October 2014. The six CBSAs that showed year-over-year declines were Hartford-West Hartford-East Hartford, Conn.; Worcester, Mass.-Conn.; Greensboro-High Point, N.C.; Rochester, N.Y.; Camden, N.J. and Winston-Salem, N.C.