A trio of newly released data reports a steady decline in foreclosures and a somewhat slower drop in negative equity levels. However, there a decline was also recorded in the profits generated by independent mortgage bankers.
First, the good news: in the latest National Foreclosure Report released by CoreLogic, there were 41,000 completed foreclosures nationally in October, down from 55,000 in October 2013, a year-over-year decrease of 26.4 percent and a 65 percent drop from the peak of completed foreclosures in September 2010. On a month-over-month basis, completed foreclosures were down by 34.1 percent from the 62,000 reported in September 2014.
As of October, CoreLogic determined that approximately 605,000 homes nationally were in some stage of foreclosure, compared to 875,000 in October 2013, a year-over-year decrease of 30.9 percent. October marked 36 consecutive months of year-over-year declines.
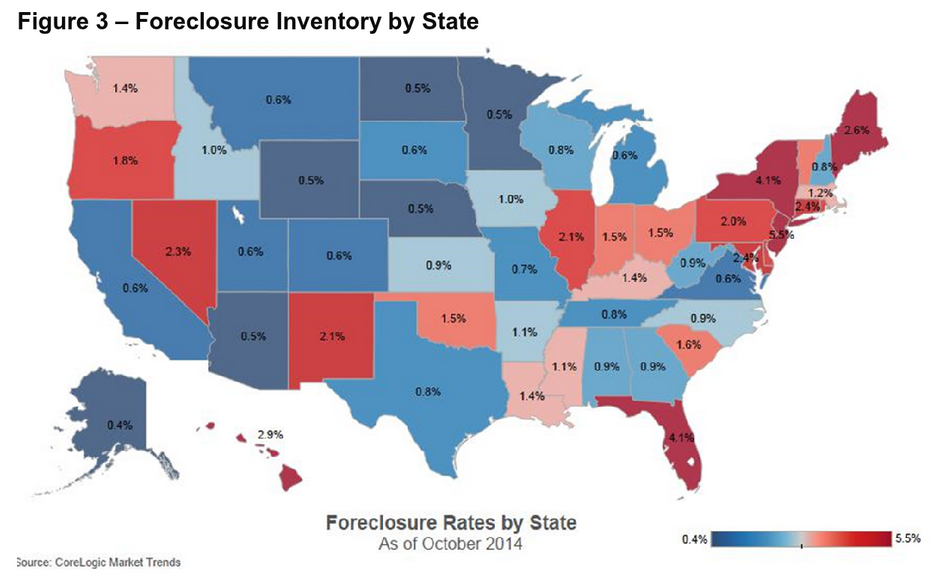
The foreclosure inventory as of October made up 1.6 percent of all homes with a mortgage, compared to 2.2 percent in October 2013. On a month-over-month basis, the foreclosure inventory was down 2.1 percent from September 2014. The current foreclosure rate of 1.6 percent is the lowest inventory level since May 2008, according to CoreLogic.
“The foreclosure inventory is less than two percent and seriously delinquent loans are trending lower right now,” said Anand Nallathambi, president and CEO of CoreLogic. “At current rates, we can expect the foreclosure inventory to slip below 500,000 units during 2015.”
CoreLogic reported that every state but West Virginia and the District of Columbia posted double-digit declines in foreclosure inventory year over year, with West Virginia declining 8.9 percent and the District of Columbia bucking the trend with a 17.3 percent increase. The five states with the highest number of completed foreclosures for the 12 months ending in October 2014 were: Florida (118,000), Michigan (45,000), Texas (36,000), California (29,000) and Georgia (28,000); CoreLogic stated that these five states accounted for almost half of all completed foreclosures nationally.
Nonetheless, CoreLogic warned that it was too early to declare “mission accomplished” in the fight against the post-recession foreclosure rates.
“While there has been a large improvement in the reduction of foreclosure inventory, completed foreclosures remain high and serve as one of the obstacles to new single-family construction,” said Sam Khater, deputy chief economist for CoreLogic. “Until the flow of completed foreclosures declines to normal levels, new-home construction will not pick up because builders have little incentive to compete with foreclosure stock.”
Separately, Black Knight Financial Services (BKFS) issued latest Mortgage Monitor report, which found eight percent of mortgages were underwater as of October, representing approximately four million borrowers whose negative equity positions averaged $39,000.
 “Over the past two-and-a-half years, there has been sustained and continual improvement in the number of underwater borrowers in this country,” said Trey Barnes, Black Knight’s senior vice president of Loan Data Products. “From 33.5 percent of borrowers being in negative equity positions in January 2012, we’re now looking at less than eight percent of borrowers underwater. However, there are still four million borrowers who owe more on their mortgages than their homes are worth, despite more than two years of relatively steady home price appreciation. Borrowers in negative equity positions represent $800 billion dollars of mortgage debt overall, with some $157 billion of that being underwater, and the data shows these borrowers are 10 times more likely to be delinquent than those with positive equity.”
Black Knight also found that there were approximately 1.3 million underwater Fannie Mae- and Freddie Mac-backed mortgages represented an aggregate $39 billion in negative equity as of October, with 365,000 of these loans in delinquency. Black Knight acknowledged the rekindled political debate on principal reduction, especially in regard to the government-sponsored enterprises, and warned that the cost of such an endeavor will be more than a little expensive.
“With an aggregate 40 percent delinquency rate among borrowers with current combined loan-to-value ratios above 100 percent—a number that rises to over three out of every four for severely underwater borrowers (those with CLTVs of 150 percent or higher)—the scope and cost of such write-downs would be immense,” said Barnes. “Some $89 billion in principal reductions would be required to right-side these borrowers. For the 365,000 delinquent underwater loans backed by Fannie Mae and Freddie Mac alone, nearly $18 billion in write-downs would be called for.”
The states with the highest percentage of non-current loans as of October, according to Black Knight, were Mississippi, New Jersey, Louisiana, New York and Florida, while those with the lowest percentage of non-current loans were Montana, Colorado, South Dakota, Alaska and North Dakota.
 Perhaps this continued state of tumult was responsible, in some way for the drop in industry profits during the third quarter of this year. In the new Quarterly Mortgage Bankers Performance Report issued by the Mortgage Bankers Association (MBA), independent mortgage banks and mortgage subsidiaries of chartered banks reported a net gain of $897 on each loan they originated in the third quarter of 2014, down slightly from a reported gain of $954 per loan in the second quarter of 2014. This drop came despite having average production volume increase during the quarter to $437 million per company, up from $378 million per company in the second quarter of 2014, an increase of 16 percent. The volume by count per company averaged 1,901 loans in the third quarter, up from 1,676 loans in the second quarter.
The average production profit was 42 basis points (bps) in the third quarter, compared to an average net production profit of 46 bps in the second quarter. The MBA stated that since the inception of its Performance Report in the third quarter of 2008, net production income has averaged 54 bps with a median of 50 bps.
Total loan production expenses—defined by the MBA as commissions, compensation, occupancy, equipment, and other production expenses and corporate allocations—decreased to $6,769 per loan in the third quarter of 2014, from $6,932 in the second quarter. Personnel expenses averaged $4,401 per loan in the third quarter of 2014, from $4,423 per loan in the second quarter.
However, secondary marketing income was 261 bps in the third quarter of 2014, compared to 270 bps in the second quarter.
“Production profits were slightly down because of a decrease in secondary marketing income,” said Marina Walsh, MBA’s vice president of industry analysis.