Home prices were on the rise in August, although two leading data sources differed on the level of acceleration experienced during that month.
According to the S&P CoreLogic Case-Shiller Indices, a 5.3 percent annual gain was recorded for the August U.S. National Home Price NSA Index, covering all nine U.S. Census Divisions, up from the five percent annual gain recorded in July. The 10-City Composite posted a 4.3 percent annual increase, up from 4.1 percent in July, while the 20-City Composite reported a year-over-year gain of 5.1 percent, up from July’s five percent reading.
Before factoring in a seasonal adjustment, the National Index posted a month-over-month gain of 0.5 percent while the 10-City Composite and the 20-City Composite both posted a 0.4 percent increase. After a seasonal adjustment, the National Index recorded a 0.6 percent month-over-month increase, while both the 10-City Composite and the 20-City Composite saw 0.2 percent month-over-month increases. After seasonal adjustment, 14 cities saw home prices rise, four cities saw prices decline and two cities were unchanged.
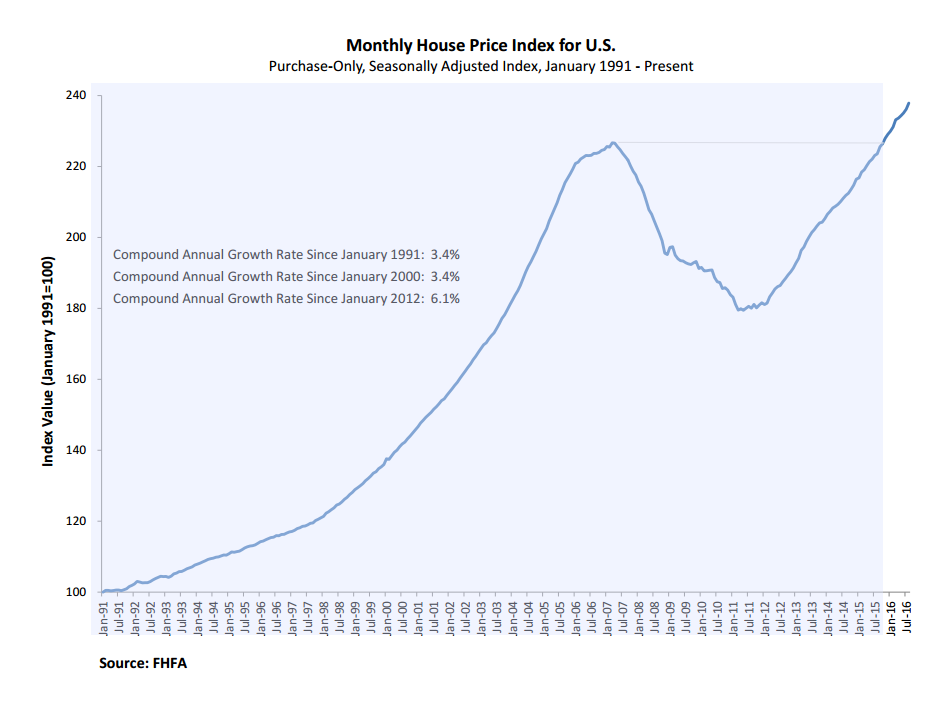
David M. Blitzer, managing director and chairman of the Index Committee at S&P Dow Jones Indices, viewed the latest numbers through a macroeconomic spectrum. “With the national home price index almost surpassing the peak set 10 years ago, one question is how the housing recovery compares with the stock market recovery,” Blitzer said. “Since the last recession ended in June 2009, the stock market as measured by the S&P 500 rose 136 percent to the end of August while home prices are up 23 percent. However, home prices did not reach bottom until February 2012, almost three years later. Using the 2012 date as the starting point, home prices are up 38 percent compared to 59 percent for stocks. While the stock market recovery has been greater than the rebound in home prices, the value of Americans’ homes at about $22.3 trillion is slightly larger than the value of stocks and mutual funds at $21.2 trillion.”
Separately, the Federal Housing Finance Agency (FHFA) reported that U.S. house prices rose in August by 0.7 percent on a seasonally adjusted basis from July. The previously reported 0.5 percent increase in July remained unchanged. For the nine Census Divisions, seasonally adjusted monthly price fluctuations from July to August covered the range from no change in the West North Central Division to a 1.2 percent uptick in the New England Division. There was more activity in the 12-month change reading, a 3.3 percent increase in the Middle Atlantic Division to 7.9 percent rise in the Pacific Division.