
Black Knight: Delinquencies Increased Nearly 2% in July – NMP Skip to main content

Black Knight: Delinquencies Increased Nearly 2% in July

Aug 24, 2022
Black Knight August 24
Staff Writer

The national foreclosure rate remained just above the record low set in May.

KEY TAKEAWAYS
  • Mortgage delinquencies rose 1.98% last month to a national delinquency rate of 2.89%.
  • Serious delinquencies improved in July after worsening for the first time in 22 months in June.

The national mortgage delinquency rate increased nearly 2% in July, but remained just above the record low set in May, according to a new report.

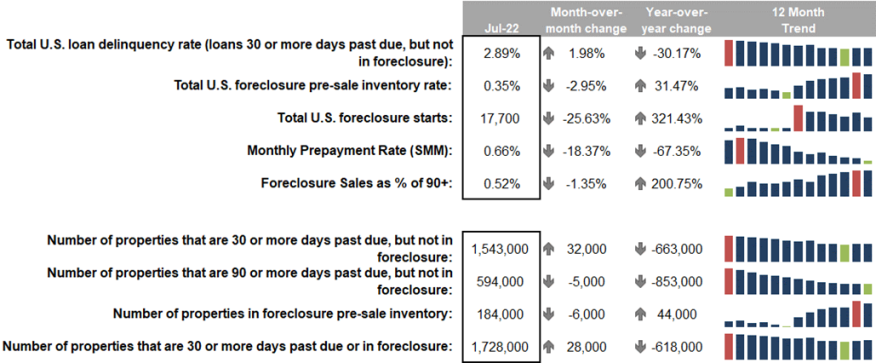
Black Knight Inc. today released its First Look at July’s mortgage performance data, finding that the mortgage delinquency rate increased to 2.89%, up 1.98% from June, driven in part by a 4% increase in early-stage delinquencies.

Despite the increase, the rate remains just 14 basis points higher than the record low set in May. Delinquencies are still down more than 30% from this time last year 

Serious delinquencies — loans 90 or more days past due, but not yet in active foreclosure — totaled 594,000 in July, a decline of 5,000 or 0.84%, after worsening in June for the first time in 22 months.

The number of seriously delinquent loans curing to current has fallen steadily over recent months, Black Knight said, from 104,000 in March to 58,000 in July, indicating that the easiest workouts have likely been completed.

Foreclosure starts also fell 25% from June to a total of 17,700 — 55% below pre-pandemic levels for the month of July, and equal to just 3% of 90+ day past-due loans, the company said.

Though still up from the record lows that resulted from widespread moratoriums and forbearance protections last year, the number of loans in active foreclosure declined by 6,000 in July to 184,000, Black Knight said.

Black Knight said prepayment activity also continued to trend downward in the higher mortgage rate environment. Prepays dropped 18% in July and are now down 67% from this time last year, it said.

Mississippi led all states with the highest percentage of non-current loans, at 6.44%. It was followed by Louisiana (5.75%), Oklahoma (4.89%), Alabama (4.88%), and West Virginia (4.74%).

About the author
Staff Writer
Sarah Wolak is a staff writer at NMP.
Published
Aug 24, 2022
Higher Mortgage Rates Shrink Purchase Demand, Expand Buyer Leverage

Pending sales fell to their lowest level since early April, but lower asking prices and reduced competition give originators more options to structure deals for qualified borrowers

Jul 31, 2026
Even Stable Public-Service Careers No Longer Guarantee Homeownership

Younger teachers, health care workers, first responders, and military households can afford median-priced homes in only a fraction of major metros

Jul 31, 2026
Buyers Gain Negotiating Power In 41 Major Housing Markets

Price cuts and longer listing times are creating opportunities for loan officers to help borrowers negotiate seller concessions, but leverage varies sharply by metro

Jul 30, 2026
Fannie Mae Purchase Volume Jumps 33% In Second Quarter

The GSE financed 201,000 home purchases, while appraisal alternatives pushed estimated borrower closing-cost savings to $3 billion

Jul 29, 2026
Second-Home Lending Grows Faster Than Primary-Home Market

Vacation-home mortgages rose 4.1% in 2025, led overwhelmingly by affluent borrowers

Jul 28, 2026
Credit Score Battle Picks Up Speed With FICO, VantageScore Gains

FICO 10T enrollment tops 70 lenders while VantageScore 4.0’s presence in TransUnion mortgage credit pulls jumps from less than 5% to roughly 30%

Jul 28, 2026