If you ask Andy Walden, Black Knight Inc.’s vice president of enterprise research, to explain the current state of the housing market, he will tell you it’s all about the relationship between mortgage rates, housing inventory, and home prices.
“The interplay between inventory, home prices and interest rates has been the defining characteristic of the housing market for the last two years, and this continues to be the case,” Walden said recently.
His comments were released as part of Black Knight’s monthly Mortgage Monitor Report for January 2023, released late last week by the company’s Data & Analytics division. The report is based on the company’s mortgage, real estate, and public records datasets and analyzes data from the first month of the year.
With both supply and demand in the housing market being affected by a volatile interest rate environment, the report looks at the continuing — and worsening — shortage in the inventory of homes for sale and the role it plays in keeping affordability tight and home prices elevated.
“We see buyer demand dampened under pressure from rising rates and their impact on affordability, with purchase rate-lock volumes cooling in late February,” Walden said. “However, when rates ticked down closer to 6% early in the month, we saw a rebound of buyside demand.”
“On the other side of the equation,” he continued, “we’ve seen a consistent theme of potential sellers — many with first-lien rates a full 3 percentage points below today’s offerings — pulling back from putting their homes on the market.”
4 Straight Months Of Decline
In fact, Walden said, January marked the fourth consecutive monthly decline in overall for-sale inventory, according to Black Knight’s Collateral Analytics data, “with the primary driver being a 25-month stretch of new listing volumes running below pre-pandemic averages.”
“While demand remains weak,” he said, “faltering supply has resulted in months of available inventory stagnating near 3.1 in recent months.”
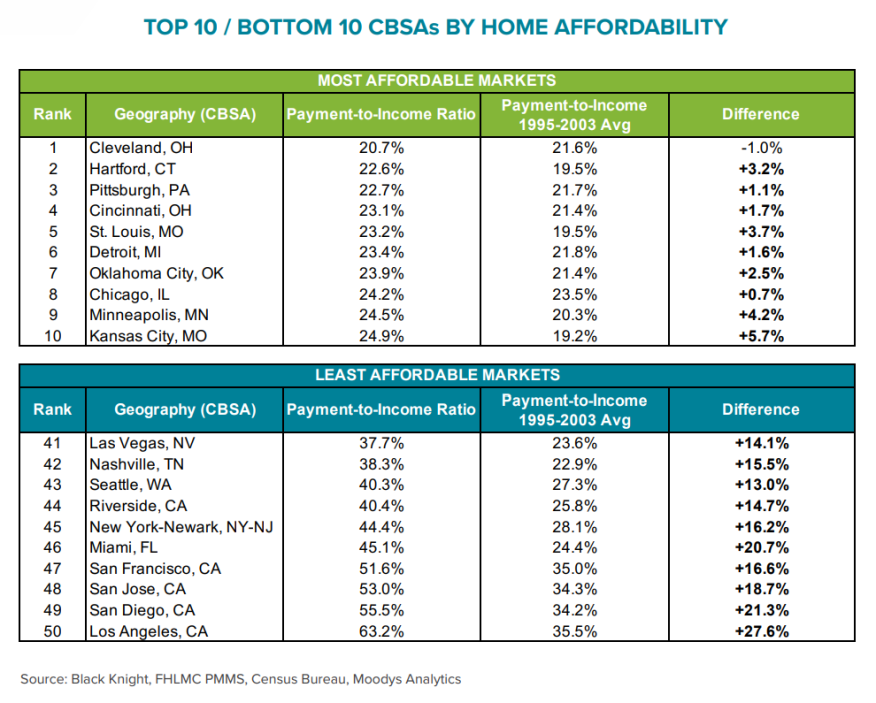
Sharp increases in the 30-year mortgage rate in February weakened home affordability, according to the report, with nearly all major U.S. markets remaining unaffordable compared to their long-term averages.
“With 30-year rates at 6.5% in late February, it took 33.2% of the median household income to make the monthly principal and interest payments on the average home purchase,” Walden said. “That’s up from January’s 32.4%, and significantly above the 30-year average of about 24%, but still 3.5 percentage points below the 37% level reached in October 2022 when affordability hit a more than 35-year low.”
He added that, “Between escalating inventory challenges and worsening affordability, we’re seeing some volatility in the market — just not in the form of widespread, steep price corrections.”
Based on Black Knight’s Home Price Index (HPI), the Mortgage Monitor Report for March found that prices fell again in January 2023, pulling back by 0.24% from a month earlier and by 0.13% on a seasonally adjusted basis.
Price Growth Trends Downward
January marked the seventh consecutive month of falling home prices, but the month’s decline was the smallest during that span, the report said. Home prices are now down 5.5% from their June peak (or down 2.9% seasonally adjusted), it said.
The annual home price growth rate — which tracks the growth over the previous 12 months – fell to 3.4% in January, more than a full percentage point below the 30-year average. In fact, the report said, the annual growth rate is on pace to fall below 0% by March/April.
Price growth could strengthen again if 30-year rates continue to climb, as they have through late February and into early March, although tight inventory will put a floor on how much prices will ease, the report said.
The Data & Analytics division of Black Knight manages a repository of loan-level residential mortgage data and performance information covering the majority of the overall market, including tens of millions of loans across the spectrum of credit products and more than 160 million historical records. The report covers 95% of U.S. residential properties down to the ZIP-code level.
Other Key Highlights
- At 3.38%, the national mortgage delinquency rate declined 10 basis points (bps) in January and is now down 15% (60 bps) year over year.
- January’s 2.9% decline in delinquencies was broad-based, led by a 4.8% drop in early stage delinquencies (30 days past due); 60-day and 90-day delinquencies both decreased slightly (0.8% and 0.6% respectively).
- Serious delinquencies (90+ days past due) continued to improve nationally, falling by 4,000, with 44 states seeing volumes shrink in the month, while Florida added another 1,700 in the wake of Hurricane Ian.
- As the 10-year Treasury rate ticked up 53 bps from its February low, the 30-year mortgage rate has followed suit, increasing 66 bps, widening the spread to mortgage rates only slightly to 271 bps.
- Treasury rates fell in late January on what markets perceived as hints of the Fed potentially easing, but rose in February on better-than-expected job market data.
- Driven by the rate dip, mortgage purchase locks started the year strong, with a 64% increase between week 1 and week 4, but after four more weeks the level is less than 5% above that of week 4, lagging through what is traditionally a strong buying season.
- Of the 216,000 refinances in Q4, 96% were cash-out loans, the highest such share of any quarter on record.
- An estimated 1.98 million cash-out refinances were completed in 2022, representing more than 80% of all refinance lending for the year.
- There were fewer than 10,000 rate/term refinances in Q4 2022, by far the fewest of any quarter on record (prior to 2023, the lowest quarter on record was 76,000 in 2018, with an average of 650,000 per quarter over the past 15 years); for context, there were 1.8 million in Q1 2021 alone (190 times more than in Q4 2022).