Homebuyer assistance programs aren’t just growing, they’re becoming more flexible, with higher income caps, more options for repeat buyers, and broader support for manufactured and multifamily homes.
According to the latest count from Down Payment Resource, there were 2,619 active assistance programs nationwide as of the end of last year. While the total count is five programs fewer than the third quarter of 2025, it is a 6% increase from a year earlier.
On average, these programs provide some $18,000 in benefits, reducing a homebuyer’s loan-to-value ratio by 8.8% and strengthening borrower qualification and overall loan profiles.
Beyond down payments, many programs also help cover closing costs, prepaid expenses, mortgage-rate buydowns, and reductions in mortgage insurance costs. In some cases, eligible buyers can layer multiple programs to further improve affordability.
Downpayment programs are some of “the most practical tools lenders have to address it,” said DPR Founder and CEO Rob Chrane. “When DPA lowers loan-to-value ratios and helps cover upfront costs, it doesn’t just improve borrower eligibility; it improves loan quality. As prices remain elevated and rates fluctuate, lenders that proactively integrate DPA into their origination strategies are better positioned to turn qualified demand into sustainable homeownership.”
Some data points from the DPR’s latest report:
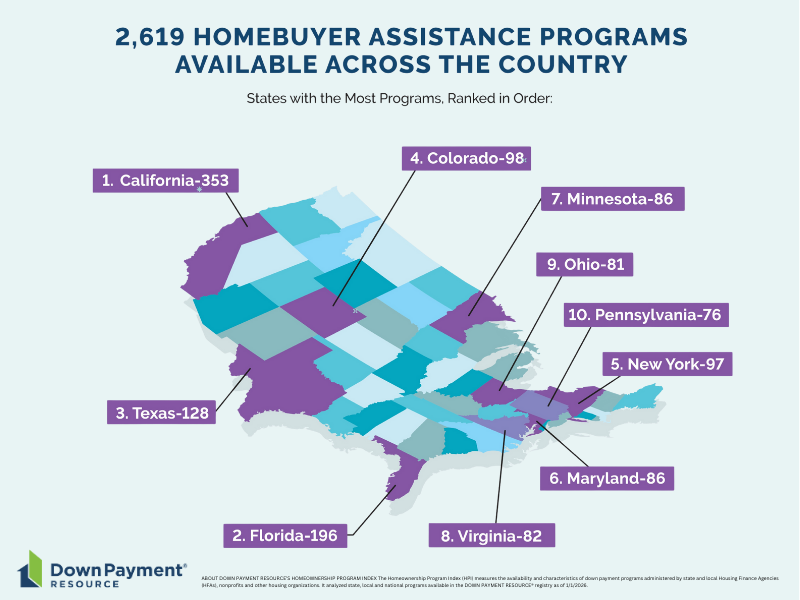
- Every U.S. county has at least one DPA program, and more than 2,000 have 10 or more. By state, California has the most with 353 programs from 223 providers. Florida has 196 programs from 128 providers. Texas has 128 programs from 63 providers.
Benefits and home income caps are rising. 1,599 programs (62%) have an average income limit exceeding $100k across the programs’ footprints. Additionally, 270 programs (10%) do not have income restrictions, thereby increasing the number of buyers who may qualify for assistance. This “income-free” requirement represents a 15% YoY increase, giving lenders a wider box to qualify borrowers. - Support for first-time buyers and first-gen buyers. 1,639 programs (63%) are open to first-time buyers, an 8% YoY rise. First-generation buyers, defined as buyers and their parents who have never owned a home, are supported by 33 programs, a 32% YoY increase. Some 980 programs (37%) are available to repeat buyers, a 3% YoY increase.
- Servicemembers and veterans are exempted from 246 programs (9%). This exemption allows them to qualify even if they have previously purchased a residence, representing a 12% YoY increase.
- Buyers of newly constructed homes are supported by 2,113 (81%) of the programs. These programs typically help cover a portion of the buyer’s down payment and/or closing costs, similar to assistance for resale properties. This new data is being tracked by DPR with no historical YoY data.
- Buyers of multifamily housing (1–4 units) are eligible for 923 programs, a 15% YoY increase. Of these, a growing number of programs support purchasing three-unit homes (607) and four-unit homes (580), both of which saw a 13% YoY increase. Investing in multifamily properties can generate cash flow and offer tax advantages to buyers.
- Buyers of manufactured housing are supported by 1,014 programs, a slight slide from the previous quarter but 14% higher YoY. New manufactured homes cost roughly $85 per square foot, compared with about $166 per square foot for site-built homes, according to the Manufactured Housing Institute (MHI).
- The majority of programs (1,461, or 56%) are second-mortgage programs, up 4% YoY, while 242 programs are first-mortgage programs, up 1% YoY. Some 37 were “other assistance” programs, meaning they consist of components that don’t neatly fit into the other categories, such as an interest rate reduction benefit. Other assistance programs are 85% higher YoY. Some 273 are combined assistance programs, 18% higher YoY. Some 207 programs are grants, up 17% YoY. 139 programs are below-market-rate (BMR) or resale-restricted, up 49% YoY, giving low- to moderate-income households more opportunities to achieve homeownership.
- The majority of DPA loans are structured to be forgivable — 1,035 DPA programs (53%) offer partial or full forgiveness over time, a 5% YoY increase. These programs may require that buyers meet specific requirements, such as living in the home as their primary residence for a certain number of years.
- DPA is offered by a wide variety of providers: 1,027 programs (39%) were offered through municipalities or local program providers, a 6% YoY increase while 562 programs (21%) are sponsored by nonprofits, a 7% YoY increase. State housing authorities (HFAs) accounted for 466 (18%) of the sponsors, 1% higher YoY.
- Some programs offer special incentives based on the buyer’s occupation or other characteristics. Of the 201 special incentive programs, 71 (35%) support educators, up 4% YoY; 56 programs (28%) assist Native American homebuyers, 19% higher YoY, and 54 programs (27%) are available to military veterans (up 10% YoY).