Mortgage rates fell in January, but housing costs and low inventory continued to deter buyers, according to a report from Redfin.
The Seattle-based digital real estate brokerage said pending home sales rose 0.5% from a month earlier in January on a seasonally-adjusted basis, the second consecutive month-over-month increase. Still, it was down from December's revised month-over-month increase of 1.4%, the first increase in 14 months.
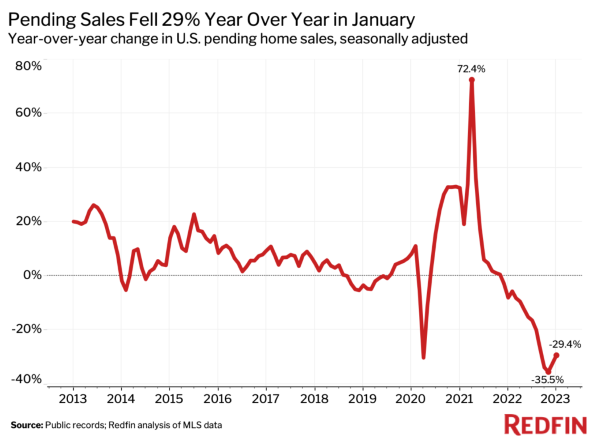
Pending sales fell from a year earlier, but the decline eased for the second month in a row — to 29.4% in January from 32.5% in December and a record 35.5% drop in November. Redfin’s records date back to 2012.
“A dip in mortgage rates brought some buyers off the bench in January, but the housing-market recovery was tempered by still-high housing costs and a limited number of homes being listed for sale,” said Redfin Deputy Chief Economist Taylor Marr. “There were fewer new listings in January than at any point on record, with the exception of the start of the pandemic. That hampered demand because it meant that many of the buyers who were still in the market had a tough time finding a home that met their needs. The shortage of homes for sale also buoyed home prices.”
According to Marr, the housing market “took two steps forward in December and January, but has taken one step back in February. Mortgage rates crept back up this month, which is prompting more buyers and sellers to back off.”
Home-purchase applications dropped to the lowest level since 1995 last week as mortgage rates jumped on expectations that the Federal Reserve will need to increase interest rates again to fight inflation. The average 30-year-fixed mortgage rate is now 6.5%, up from an average of 6.27% in January and from 3.89% a year ago. That has caused the typical homebuyer’s monthly payment to rise more than $500 year over year, Redfin said.
Closed home sales in January fell 1.4% from December, and slumped a record 36.6% from a year earlier. In Redfin’s December market report, the company noted that the year-over-year decline in closed sales had eased slightly, but that didn’t continue into the new year.
The large drop in closed sales is partly due to the fact that many of the home purchases that closed in January went under contract in the fall, when mortgage rates hit a 20-year high.
New Listings Drop
New listings fell 1.6% from a month earlier in January and dropped 19.9% from a year earlier. While that’s an improvement from the 25.3% year-over-year decline in December — the largest drop on record aside from the pandemic start — listings remained scarce. There were fewer new listings in January than any other month on record aside from April 2020, when the onset of the pandemic brought the housing market to a halt.
Many homeowners are reluctant to sell because they don’t want to give up their relatively low mortgage rates. About 85% of mortgage holders have a rate far below today’s level above 6%.
Homeowners are also hesitant to put their homes on the market due to the soft homebuyer demand that’s forcing sellers to cut prices. The median sale price of U.S. homes was $383,249 in January, down 1.4% from December and 11.5% below the May all-time high. Still, prices were up 1.5% from a year earlier, in part because low supply kept prices afloat.
Almost one in every five home listings (17.7%) had a price drop last month. While that’s down from the record high of 22.2% in October, it’s up from 7% in January 2022 — the largest year-over-year increase on record. Just 21.2% of homes sold above their final list price, the lowest level in two years.
“Nice homes that are priced fairly are selling, but homes that are overpriced or poorly maintained are lingering on the market,” said Shay Stein, a Redfin real estate agent in the Las Vegas area. “A lot of sellers who don’t get the price they had hoped for are taking their homes off the market. Many of them have a rock-bottom mortgage rate and figure they can wait to sell.”
The typical home that sold was on the market for 51 days—the highest level since February 2020. That’s up from 27 days in January 2022. Homes are taking longer to sell in part because homebuyer competition has dwindled. Roughly two of every five home offers (42.1%) written by Redfin agents faced a bidding war in January, the lowest level since April 2020. That’s down from 43.1% a month earlier and 68% a year earlier. Pandemic boomtowns including Austin and Tampa saw among the largest declines in competition, as many homebuyers have been priced out.
Other Key Highlights
- Pending home sales in January, seasonally adjusted, totaled 397,838, up 0.5% from December but down 29.4% from the same month last year.
- Home sales in January, seasonally adjusted, totaled 405,602, down 1.4% from December and down 36.6% from a year earlier.
- New listings in January, seasonally adjusted, totaled 475,381, down 1.6% from December and down 19.9% year over year.
- The overall number of homes for sale, seasonally adjusted, was 1.61 million, down 1.2% from December but up 14.5% from a year earlier. That is equal to a 3.2 months supply, which is up 0.7% from December and up 1.7% YOY. Active listings hit a record low in January 2022, which is one reason the year-over-year increase is so dramatic.
- The median number of days a home for sale spent on the market in January was 51, up seven days from December and up 24 days YOY.
- 17.7% of homes for sale dropped in price during January, up 3.3 percentage points from December and up 10.7 percentage points from January of last year.
- 21.2% of homes in January sold above the final list price, down 1.9 percentage points from December and down 21.3 percentage points YOY.
- The share of home offers written by Redfin agents that faced competition in January, seasonally-adjusted, was 42.1%, down 1 percentage point from December and down 25.9 percentage points from a year earlier.
- 14.1% of pending sales in January fell out of contract, down 2.1 percentage points from December but up 2 percentage points from a year earlier.
Metro-Level Highlights
- Pending sales: In Baton Rouge, La., pending sales fell 62.4% year over year, more than any other metro Redfin analyzed. It was followed by Honolulu (-60%), New Orleans (-54.7%), Las Vegas (-52.6%), and Phoenix (-48.8%). Pending sales rose in just five metros: Cincinnati (29.7%); Lake County, Ill. (19.7%); Chicago (10.1%); Detroit (4.7%); and Rochester, N.Y. (3.6%).
- Prices: Median sale prices fell from a year earlier in 29 metros, led by San Francisco (-9.4%). Next came Honolulu (-8%); Detroit (-8%); Oakland, Calif. (-7.8%); and Fresno, Calif. (-6.7%). The biggest increases were Indianapolis (13.1%); West Palm Beach, Fla. (13.1%); Greensboro, N.C. (12.5%); Dayton, Ohio (11.1%); and Allentown, Pa. (10.7%).
- Listings: New listings fell the most from a year earlier in Greensboro (-43.6%); Allentown (-42.5%); Sacramento, Calif.(-40.6%); San Diego (-38.7%); and San Jose, Calif. (-38.4%). They rose in six metros: North Port, Fla. (12.5%); McAllen, Texas (8.3%); Nashville, Tenn. (5.4%); West Palm Beach, Fla. (1.4%); Austin, Texas (1.1%); and Dallas (0.8%).
- Supply: Active listings rose the most from a year earlier in North Port (95.5%); Austin (75.6%); Nashville (73.5%); Fort Worth, Texas (64.5%); and Dallas (64.4%). They fell the most in Greensboro (-28.8%); Milwaukee (-25.6%); Allentown (-24%); Hartford, Conn. (-21.9%); and Bridgeport, Conn. (-18.7%).
- Competition: In Austin, 28.7% of home offers written by Redfin agents faced competition, down 47.7 percentage points (ppts) from a year earlier — the largest decline among the 33 metros Redfin analyzed. Other pandemic boomtowns rounded out the top five: Raleigh, N.C. (-47.3 ppts); Tampa, Fla. (-46.2 ppts); Honolulu (-42 ppts); and Colorado Springs, Colo. (-41.4%). Competition fell the least in Worcester, Mass. (-5 ppts); Providence, R.I. (-6 ppts); New York (-9.3 ppts); Boston (-10.7 ppts); and Washington, D.C. (-12.5 ppts).