Home prices continued to climb in the vast majority of the U.S. during the third quarter of 2024, basking in pent-up demand and deficient housing supply.
Sale prices of single-family existing homes climbed in 87% of 226 measured metro areas July through September, down from 89% in the prior quarter. In that same time, the national median home price grew 3.1% from Q3 2023, to $418,700, the National Association of Realtors (NAR) reported.
However, less markets overall experienced a double-digit price appreciation on an annual basis during Q3, at 7% (down from 13% in Q2).
In addition, the monthly mortgage payment on a typical, existing single-family home with a 20% down payment was $2,137 – down 2.4% from the year prior.
Both of these facts point to strained affordability improving in the long run, according to Lawrence Yun, chief economist for NAR.
“Housing affordability has been a challenge, but the worst appears to be over,” Yun pointed out. “Rising wages are outpacing home price increases. Despite some short-term swings, mortgage rates are set to stabilize below last year’s levels. More inventory is reaching the market and providing additional options for consumers.”
First-time home buyers now comprise a higher percentage of the nation’s purchase market – a trend Freddie Mac identified in its data earlier in the year.
Affordability conditions improved slightly for FTHB in Q3, compared to the previous quarter, using NAR’s analysis. For a typical starter home valued at $355,900 with a 10% down payment loan, the monthly mortgage payment declined to $2,097, down 5.5% from Q2, when it was $2,218. That was a decrease of $49, or 2.3% YOY.
Sale prices of existing homes increased the most year-over-year during Q3 in the Northeast (7.8%), followed by the Midwest, (4.3%) the West, (1.8%) and lastly, the South, where prices increased just 0.8%. Seemingly not by coincidence, the South registered the largest share of single-family existing-home sales (45.1%) in Q3.
“Home prices remain on solid ground as reflected by the vast number of markets experiencing gains,” Yun commented. “A typical homeowner accumulated $147,000 in housing wealth in the last five years. Even with the rapid price appreciation over the last few years, the likelihood of a market crash is minimal. Distressed property sales and the number of people defaulting on mortgage payments are both at historic lows.”
CoreLogic’s latest Home Price Index and Forecast indicated prices rose by 3.4% in September – the slowest growth rate in over a year – and are projected to slow to 2.3% by Sept. 2025.
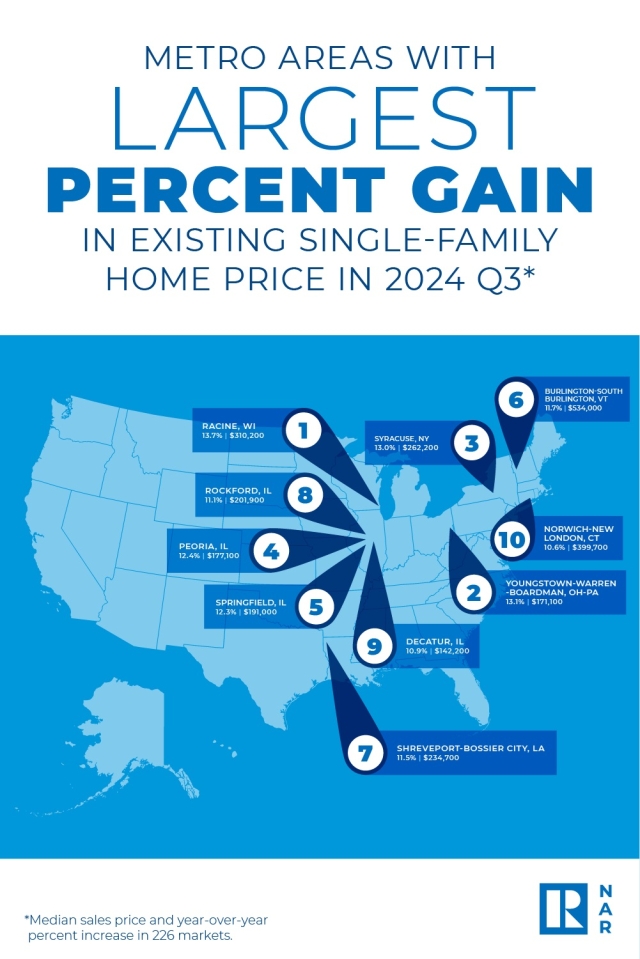
Highest Price Increases In Q3 2024
The NAR's top metro areas with the largest YOY median price increases were Racine, Wis. (13.7%); Youngstown-Warren-Boardman, Ohio-Pa. (13.1%); Syracuse, N.Y. (13.0%); Peoria, Ill. (12.4%); Springfield, Ill. (12.3%); Burlington-South Burlington, Vt. (11.7%); Shreveport-Bossier City, La. (11.5%); Rockford, Ill. (11.1%); Decatur, Ill. (10.9%); and Norwich-New London, Conn. (10.6%).
Priciest Markets For Q3 2024
Eight of the top 10 most expensive markets in the U.S. were in California. Overall, those markets were San Jose-Sunnyvale-Santa Clara, Calif. ($1,900,000; 2.7%); Anaheim-Santa Ana-Irvine, Calif. ($1,398,500; 7.2%); San Francisco-Oakland-Hayward, Calif. ($1,309,000; 0.7%); Urban Honolulu, Hawaii ($1,138,000; 7.2%); San Diego-Carlsbad, Calif. ($1,010,000; 3.2%); Salinas, Calif. ($959,800; 1.5%); San Luis Obispo-Paso Robles, Calif. ($949,800; 6.7%); Los Angeles-Long Beach-Glendale, Calif. ($947,500; 5.6%); Oxnard-Thousand Oaks-Ventura, Calif. ($947,400; 2.8%); and Boulder, Colo. ($832,200; -3.0%).