Two different indexes released Tuesday show that home prices continue to increase.
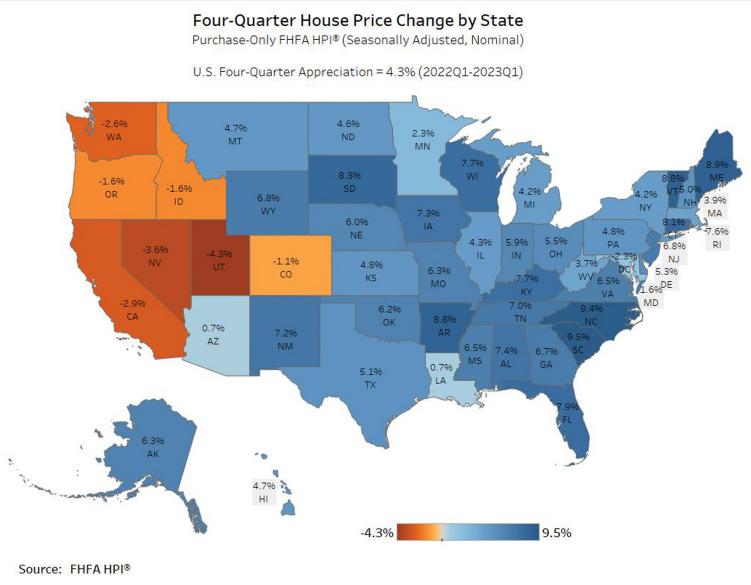
The Federal Housing Finance Agency (FHFA) House Price Index showed that prices nationwide in the first quarter of 2023 were up 4.3% from the same quarter a year earlier.
It was the 45th-consecutive quarter with a year-over-year increase, the FHFA said. That's every quarter since the first quarter of 2012.
The FHFA index also showed that prices were up 0.5% from the previous quarter, and that Its seasonally adjusted monthly index for March also increased, rising 0.6% from February.
“U.S. house prices generally increased modestly in the first quarter,” said Anju Vajja, Ph.D., principal associate director in FHFA’s Division of Research and Statistics. “However, year-over-year prices in many Western states have started to decline for the first time in over 10 years.”
According to the FHFA, house prices rose in 43 states between the first quarters of 2022 and 2023. The five areas with the highest year-over-year increases were South Carolina at 9.5%; North Carolina at 9.4%; Maine at 8.9%; and both Vermont and Arkansas at 8.8%.
The areas showing the highest annual price declines were Utah at -4.3%; Nevada at -3.6%; California at -2.9%; Washington at -2.6%; and the District of Columbia at -2.3%.
House prices rose in 78 of the top 100 largest metropolitan areas over the last four quarters, the FHFA said. The annual price increase was greatest in Miami-Miami Beach-Kendall, Fla., at 14.1%. The metropolitan area with the greatest price decline was San Fransisco-San Mateo-Redwood City, Calif., at -10.1%.
Of the seven census divisions with home-price increases, the South Atlantic division recorded the strongest four-quarter appreciation, at 7.2%, between the first quarters of 2022 and 2023, FHFA said. House prices depreciated in two census divisions, it said: by 2.4% in the Pacific division and by 0.1% in the Mountain division.
The FHFA HPI is a comprehensive collection of public, freely available house price indexes that measure changes in single-family home values based on data that extend back to the mid-1970s from all 50 states and over 400 American cities. It incorporates tens of millions of home sales and offers insights about house price fluctuations at the national, census division, state, metro area, county, ZIP code, and census tract levels.
S&P CoreLogic Case-Shiller Indices
In addition to the FHFA index, the S&P CoreLogic Case-Shiller Indices were released Tuesday and also showed that prices rose in March, as all 20 major metro markets reported month-over-month price increases.
Before seasonal adjustment, the U.S. National Index posted a 1.3% month-over-month increase in March, while the 10-City and 20-City Composites posted increases of 1.6% and 1.5%, respectively, S&P Dow Jones Indices (DJI) said.
After seasonal adjustment, the U.S. National Index posted a month-over-month increase of 0.4%, while the 10-City Composite gained 0.6% and 20-City Composite posted a 0.5% increase.
“The modest increases in home prices we saw a month ago accelerated in March 2023,” said Craig J. Lazzara, managing director at S&P DJI. “The National Composite rose by 1.3% in March, and now stands only 3.6% below its June 2022 peak.”
He continued, “Our 10- and 20-City Composites performed similarly, with March gains of 1.6% and 1.5% respectively. On a trailing 12-month basis, the National Composite is only 0.7% above its level in March 2022, with the 10- and 20-City Composites modestly negative on a year-over-year basis.”
Lazzara said the accelerated price growth seen nationwide was also visible at “a more granular level.”
“Before seasonal adjustment, prices rose in all 20 cities in March [compared to 12 in February], and in all 20 price gains accelerated between February and March,” he said. “Seasonally adjusted data showed 15 cities with rising prices in March [compared to 11 in February], with acceleration in 14 cities.”
Lazzara said one of the most interesting aspects of the report is in the stark regional differences it reveals.
“Miami’s 7.7% year-over-year gain made it the best-performing city for the eighth consecutive month,” he said,. “Tampa (+4.8%) continued in second place, narrowly ahead of bronze medalist Charlotte (+4.7%). The farther west we look, the weaker prices are, with Seattle (-12.4%) now leading San Francisco (-11.2%) at the bottom of the league table. It’s unsurprising that the Southeast (+5.4%) remains the country’s strongest region, while the West (-6.2%) remains the weakest.”
Still, he said, two months of increasing prices does not mark a definitive recovery, “but March’s results suggest that the decline in home prices that began in June 2022 may have come to an end. That said, the challenges posed by current mortgage rates and the continuing possibility of economic weakness are likely to remain a headwind for housing prices for at least the next several months.”