Home affordability in the U.S. remains strained as housing costs continue to outpace wages, according to ATTOM’s Q1 2025 U.S. Home Affordability Report. The report finds that median-priced homes are historically unaffordable in 97% of analyzed counties, extending a three-year trend of high ownership costs.
Key findings include:
📉 Major homeownership expenses consume 32% of the average national wage, exceeding the preferred 28% lending guideline.
🏡 The national median home price dipped slightly to $351,000, but mortgage rates near 7% keep affordability stretched.
🌆 Despite a modest decline in unaffordable counties compared to last year, three-quarters of counties analyzed still exceed affordability thresholds.
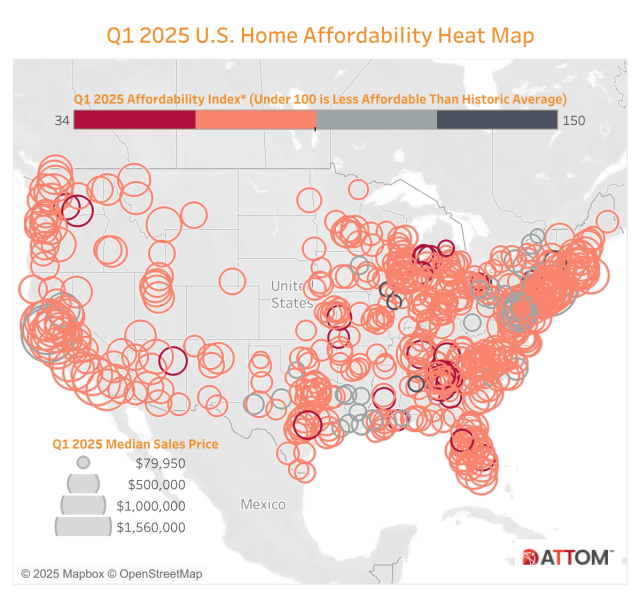
🏙️ The largest unaffordable markets include Los Angeles, Phoenix, San Diego, Orange County, and Miami-Dade. More affordable large markets include Chicago, Houston, Detroit, Philadelphia, and Cleveland.
ATTOM CEO Rob Barber noted that affordability is “in a holding pattern,” with potential price increases in the upcoming peak buying season adding further pressure.
"This is not unusual during the Winter lull when home prices level out. A recent small decline in mortgage rates surely hasn't hurt either for fledgling buyers," Barber said. "If history is a good guide, prices will rise as we head into the peak buying season that's about to start, which will worsen affordability measures."
But he cautiously added that "with so much economic uncertainty these days connected to investment markets, federal policy shifts and very mixed economic forecasts, it is anyone's guess how much prices will move."
Affordability Challenges Persist Across Most Counties
Homeownership remains historically unaffordable in 554 of the 574 counties analyzed, though this is a slight improvement from the fourth quarter of 2024. The largest counties where homeownership remains unaffordable include Los Angeles County, CA; Maricopa County, AZ; San Diego County, CA; Orange County, CA; and Miami-Dade County, FL.
Conversely, more affordable housing markets in populous counties include Cook County, IL (Chicago); Harris County, TX (Houston); Wayne County, MI (Detroit); Philadelphia County, PA; and Cuyahoga County, OH (Cleveland).
National Median Home Prices Show Modest Changes
The national median home price declined by 1% this quarter, following typical seasonal trends, yet remains 5.2% higher than Q1 2024 and 10.1% above Q1 2023. Prices have increased annually in 72.5% of analyzed counties but declined quarterly in 72.6%. Among counties with over 1 million residents, the largest annual price gains occurred in Suffolk County, NY; Nassau County, NY; Cuyahoga County, OH; Wayne County, MI; and Honolulu County, HI. Meanwhile, the biggest price drops were in Alameda County, CA; Fulton County, GA; Duval County, FL; Harris County, TX; and King County, WA.
Home Prices Outpacing Wage Growth
In nearly half (46.9%) of analyzed counties, home price growth has outpaced wage increases over the past year. This imbalance is particularly evident in major markets like Los Angeles, CA; Chicago, IL; Phoenix, AZ; Orange County, CA; and Queens, NY. Conversely, wage growth has surpassed home price increases in places like Houston, TX; San Diego, CA; Miami, FL; Brooklyn, NY; and Dallas, TX.
Homeownership Expenses And Wage Ratios
While ownership expenses as a percentage of wages declined quarterly in 70.9% of counties due to steady home values and slightly lower mortgage rates, affordability remains a challenge. Nationwide, the typical monthly ownership cost of $2,021 represents 32.5% of the average U.S. wage, down slightly from 32.7% in Q4 2024 but higher than 31.4% in Q1 2024. Nearly 72% of counties exceed the 28% affordability benchmark, with about one-third of markets requiring at least 43% of local wages for homeownership expenses.
Regional Affordability Disparities
The financial burden of homeownership remains highest along the Northeast and West coasts. The most expensive counties relative to local wages include Brooklyn, NY (109.5% of annual wages needed), Maui, HI (101.5%), and multiple counties in California. In contrast, the most affordable counties include St. Lawrence County, NY (10.3% of wages needed), Mercer County, PA (10.4%), and Peoria County, IL (11.2%).
Among counties with over 1 million residents, the most affordable include Wayne County, MI (14.7% of wages needed); Allegheny County, PA (18.7%); and Philadelphia County, PA (18.9%).
Income Requirements For Homeownership
To afford a median-priced home in Q1 2025, an annual income of $86,611 is required—15.9% higher than the average U.S. wage of $74,698. Over half (53.1%) of analyzed counties require wages above $75,000 to afford homeownership, yet only 14.1% of counties report average wages at or above that threshold. The most expensive housing markets remain concentrated on the East and West coasts, with New York County (Manhattan) requiring the highest income at $386,282 annually.