For the first time in a year, profit margins on median-priced single-family home and condo sales in the United States increased, according to a report from ATTOM.
The Irvine, Calif.-based curator of land, property, and real estate data released its 2023 U.S. Home Sales Report on Thursday, showing that profit margins increased in the second quarter of this year to 47.7%.
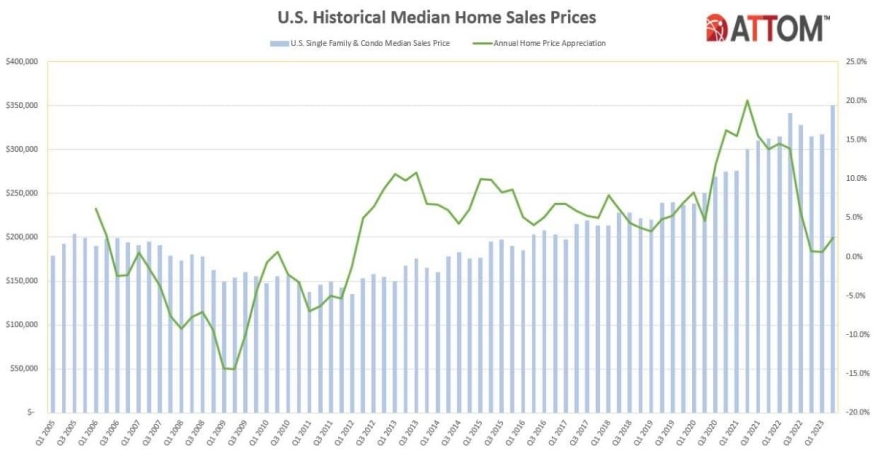
The improvement in typical profit margins, from 43.9% in the first quarter of 2023, came amid a rebound in the U.S. housing market that pushed the median nationwide home price up 10% quarterly to a record $350,000.
Both the nationwide profit margin and median home price increased after three straight quarterly drop-offs that had begun to reverse a decade-long market boom, ATTOM said.
However, even as seller fortunes turned around in the second quarter, the typical investment return nationwide remained below the recent high point of 53.2%, recorded during the second quarter of 2022.
“Just when it looked like the housing market was flattening out, prices spiked again, which pushed seller profits back up to nearly their highest level in the past decade,” said ATTOM CEO Rob Barber. “Stable mortgage rates, an ongoing tight supply of homes for sale, and the usual springtime surge in buyer demand appeared to have combined to halt the downturn we started seeing a year ago.”
Barber said it’s far too early to predict another long-term price run-up, “especially since buying a home is a financial stretch for so many households around the country. But the second-quarter numbers clearly show the market has more steam left in it, and sellers are reaping the benefits.”
A Market In Flux
Gross profits on the typical single-family home and condo sale nationwide also spiked from the first to the second quarter this year, rising 17% to $113,000, though they were still down 5% year over year.
The turnaround in profits and prices during the second quarter reflected a housing market in flux. ATTOM said.
After a decade of almost continual increases, home prices dipped across most of the country in the middle of 2022 and continued declining through the first quarter of 2023, the report said. The national median price dropped 7% during that time, as rising home-mortgage rates, high consumer price inflation, and a faltering stock market cut into what potential buyers could afford.
Prices and profits went back up in the second quarter during the start of the annual buying season, helped along by the nation’s limited inventory of homes for sale, mortgage rates that stabilized at around 6.5% for a 30-year fixed-rate loan, investment market gains, and slowly easing inflation. As the 2023 home-buying season continues, the prospect of even better seller profits remains in place, but will depend heavily on whether any or all of those factors improve or decline.
Margins Still Down YOY
ATTOM said typical profit margins — the percentage difference between median purchase and resale prices — increased from the first quarter to the second quarter of 2023 in 107 (69%) of the 156 metropolitan statistical areas around the U.S. with sufficient data to analyze.
The margins, however, were still down in 118 (76%) of those metros compared to the second quarter of last year, as the recent improvements were not enough to wipe out losses sustained from the middle of 2022 to the early part of 2023, the company said.
Watch it on The Interest: Rocket Buyouts, Sellers Still Winning
The biggest quarterly increases in typical profit margins came in the metro areas of Barnstable, Mass. (margin up from 47% in the first quarter to 69.2% in the second quarter); Fort Wayne, Ind. (up from 46.7% to 65.5%); Augusta, Ga. (up from 45.7% to 64.1%); Rochester, N.Y. (up from 50.9% to 68%); and Charleston, S.C. (up from 37.7% to 52%).
Aside from Rochester, the biggest quarterly profit-margin increases in metro areas with a population of at least 1 million in the second quarter of 2023 were in Grand Rapids, Mich. (up from 63.9% to 76.5%); Raleigh, N.C. (up from 35.8% to 47.7%), Hartford, Conn. (up from 38.5% to 50.1%) and San Diego (up from 45.3% to 56.7%).
Typical profit margins decreased quarterly in just 49 (31%) of the 156 metro areas analyzed. The biggest quarterly decreases were in Scranton, Pa. (margin down from 86.9% in the first quarter to 70.2% in the second quarter); Hilo, Hawaii (down from 101.5% to 86.7%); Detroit (down from 90%t to 76%); Spartanburg, S.C. (down from 60.6% to 46.6%) and Flint, Mich. (down from 91.6% to 80.5%).
Metro areas with a population of at least 1 million where typical profits remained down the most annually included Austin, Texas (margin down from 80.3% in the second quarter of 2022 to 47.2% in the second quarter of 2023); San Francisco (down from 85.1% to 59.4%); Phoenix (down from 75.8% to 51.6%); Salt Lake City, Utah (down from 69.3% to 46.4%); and Las Vegas, (down from 66.5% to 46.5%).
Prices Up Quarterly
Median single-family home and condo prices increased from the first to the second quarter this year in 150 (96%) of the 156 metro areas around the country with enough data to analyze, and were up annually in 94 (60%) of those metros.
Nationwide, the median home price rose to a record $350,000, up 10.4% from $317,000 in the first quarter of 2023 and 2.4% over the previous record of $341,750, set in the second quarter of last year.
Among metro areas, the biggest increases in median home prices from the first quarter to the second quarter of 2023 were in Rochester (up 20%); Madison, Wisc. (up 19.1%); Bridgeport, Conn. (up 18.6%); St. Louis (up 17%) and Augusta (up 16.9%).
Home prices tied or hit new highs during the second quarter in 89 (57%) of the 156 metro areas in the report. Metro areas with a population of more than 1 million that set or tied records in the second quarter included Chicago; Miami; Dallas; Washington, D.C.; and Atlanta.
The only metro areas with a population of at least 1 million where the median home price declined from the first to the second quarter were Honolulu, Hawaii (down 1.4%) and Salt Lake City (down 0.03%).
Tenure Rebounds
Homeowners who sold in the second quarter of 2023 owned their homes an average of 5.76 years. That was up from a low point over the past decade of 5.59 years in the first quarter of 2023, but still down from 5.84 years in the second quarter of 2022, ATTOM said.
Average tenure remained down from the second quarter of 2022 to the same period this year in 47% of metro areas with sufficient data. The largest annual declines were in Rockford, Ill. (tenure down 23%); Salem, Ore. (down 19%); Torrington, Conn. (down 17%); St. Louis (down 16%) and Manchester, N.H. (down 15%).
All 15 of the longest average tenures among sellers in the second quarter were in the Northeast or West regions of the U.S. They were led by Bellingham, Wash. (8.04 years); Manchester, N.H. (7.88 years); Honolulu (7.78 years); San Jose, Calif. (7.38 years); and Bridgeport, Conn. (7.26 years).
You can read the full report here.