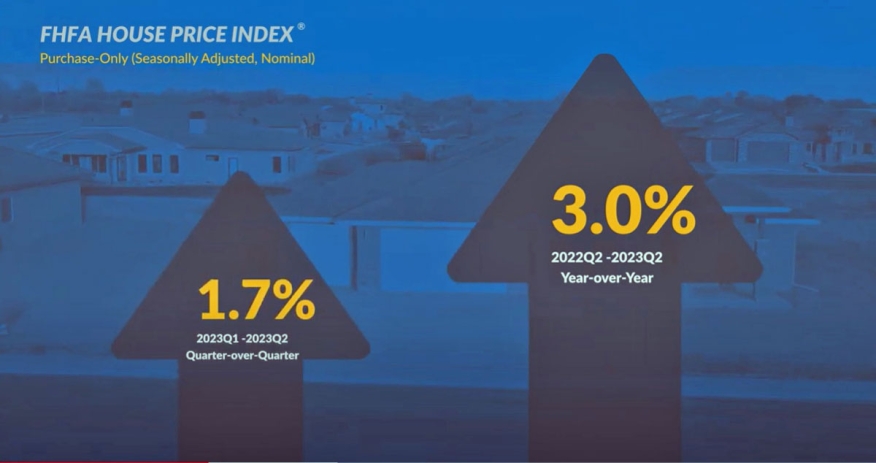
Housing prices continue to climb, according to the S&P CoreLogic Case-Shiller Indices and the Federal Housing Finance Agency House Price Index.
The FHFA says house prices were up 3% year over year for the second quarters of 2022 and 2023.
“U.S. house prices appreciated at a slightly higher rate in the second quarter amid low inventory,” said Anju Vajja, principal associate director in FHFA’s Division of Research and Statistics. “While prices in a number of Western states continued to decline year-over-year, house prices rose in all states quarter-over-quarter.”
Vajja said house prices continue to appreciate despite high mortgage rates, which landed at 7.23% last week – the highest since 2001. However, the impact of housing appreciation varies based on the region.
According to the Case-Shiller Indices, Chicago, Cleveland, and New York reported the highest year-over-year gains among the 20 cities surveyed in June. Chicago remained in the top spot with a 4.2% year-over-year price increase, with Cleveland at number two with a 4.1% increase, and New York held down the third spot with a 3.4% increase.
"June is the fifth consecutive month in which home prices have increased across the U.S. With 2023 half over, the National Composite has risen 4.7%, which is slightly above the median full calendar year increase in more than 35 years of data,” Craig J. Lazzara, managing director at S&P DJI, said. “We recognize that the market's gains could be truncated by increases in mortgage rates or by general economic weakness, but the breadth and strength of this month's report are consistent with an optimistic view of future results."
The FHFA, which tracks more data, found that house prices rose in 42 states between the second quarters of 2022 and 2023.
It says the five areas with the highest annual appreciation were 1) Maine, 7.6%; 2) Connecticut, 7.6%; 3) New Hampshire, 7.1%; 4) Arkansas, 6.9%; and 5) New Jersey, 6.9%. The areas showing the highest annual depreciation were 1) Nevada, -5.3%; 2) District of Columbia, -4.9%; 3) Utah, -4.5%; 4) Idaho, -4.1%; and 5) Washington, -3.4%.