As we near one full month since the federal government shutdown began, new data from Realtor.com’s October Monthly Housing Report shows early signs of a pause in housing activity in markets with the highest shares of federal employees. While most national housing trends have shown little change so far this fall, housing markets where federal workers make up a larger share of the local labor force — including the Washington, D.C.; Virginia Beach; and Baltimore regions — are reporting subtle shifts in buyer and seller behavior as uncertainty weighs on household confidence.
"At this stage, the housing market effects of the federal shutdown appear localized and modest," said Danielle Hale, chief economist for Realtor.com. "In markets like Washington, D.C.; Virginia Beach; Oklahoma City; and Baltimore, where many households rely on federal employment, we're seeing buyers take a brief step back as uncertainty persists. However, home prices and inventory trends in these areas continue to move in line with broader national and regional patterns, suggesting that the overall market remains steady for now."
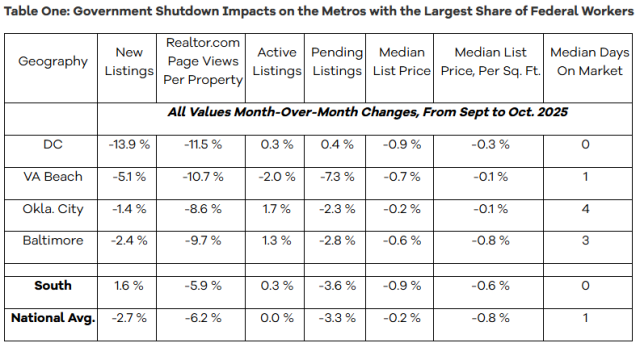
Federal employment is most concentrated in the Washington, D.C. metro, where 11% of employed residents work for the federal government, followed by Virginia Beach (7%), Oklahoma City (4.2%), and Baltimore (3.7%). In these metros, there has been a modest slowdown in new listings, with D.C. reporting a 13.9% month-over-month decline, followed by Virginia Beach -5.1%; Oklahoma City -1.4%; and Baltimore -2.4%.
A sharper decline in home search activity has been reported since the beginning of October at the outset of the shutdown, with D.C. reporting a 11.5% slide in home searches; Virginia Beach at -10.7%; Oklahoma City at -8.6%; and Baltimore at -9.7%. The slide in home searches suggests that potential buyers are pausing their search while paychecks and job security remain uncertain. While sellers in these metros are also pulling back slightly, overall housing supply remains in line with seasonal patterns seen elsewhere across the country.
Other key housing metrics like median list prices, inventory levels, and time on market have shown little movement or no clear departure from the broader regional and national trends. For example, while median list prices per square foot slightly declined month-over-month in D.C., Virginia Beach, and Baltimore, those drops are consistent with typical fall seasonality rather than evidence of shutdown-driven softening.
"While the current data points to only mild, localized effects, the longer the shutdown persists, the more likely it is that these markets and potentially others with smaller shares of federal workers could see more meaningful impacts on buyer demand, seller activity, and transaction timelines," added Hale.
Buyers Gain Options, as Inventory Growth Slows
Prospective buyers had more options in October, as the number of actively listed homes rose 15.3% compared to the same time last year, marking the 24th consecutive month of year-on-year inventory gains. However, active listing growth has slowed in each of the last five months (down from 17% in September, 20.9% in August, 24.8% in July, 28.9% in June, and 31.5% in May).
The number of homes for sale topped one million for the sixth consecutive month, a total nearly unchanged since July. Still, nationwide inventory remains 13.2% below typical levels reported in 2017-2019, approximately the same as last month, a strong indication that the nationwide inventory recovery has stalled.
Housing supply increased in all four major U.S. regions in October, but the pace of that growth has slowed recently, with the West reporting +17.4% growth; the South at +17%; the Midwest at 12.2%; and the Northeast at +8.9%.
At the metro level, all of the 50 largest markets recorded year-over-year inventory growth, with the sharpest increases reported in:
- Washington, D.C. (+38.2%)
- Charlotte, North Carolina (+36.4%)
- Las Vegas, Nevada (+35.1%)
Ten of the top 50 metros now exceed their pre-pandemic inventories by 25% or more – all in the South or West. The markets with greatest inventory relative to their pre-pandemic levels continue to be:
- Denver, Colorado (+57.0%)
- San Antonio, Texas (+51.9%)
- Austin, Texas (+44.9%)
Still, 17 of the top 50 metros still lag at least 25% below their pre-pandemic inventory norms, with the three metros that have recovered least are:
- Hartford, Connecticut (-74.0%)
- Chicago, Illinois (-56.9%)
- Providence, Rhode Island (-54.5%)
"In October, homebuyers had more options to choose from, but the pace of inventory growth continued to cool after two years of steady gains," added Hale. "Sellers are pricing with more flexibility as price cuts remain common, and homes are spending slightly more time on the market — signs that conditions are gradually shifting toward a more balanced market. Still, overall supply remains below pre-pandemic norms, keeping affordability and competition top of mind for many buyers."
Price Cuts Remain Elevated
Price cuts continue to be a key feature of the 2025 market; in October, as 20.2% of home listings reported price reductions — up 1.6 percentage points from last year, and up slightly since last month.
Price reductions in October have begun to show some more uniformity by region (around the national average), though the Northeast is an exception with price cuts on less than 15% of listings: Northeast: 14.5% of listings, Midwest: 20.2%, South: 21.3%, and West: 21.5%
Flows Slow for New Listings
Newly listed homes grew 5.1% year-over-year, but were down 2.7% since last month, and are now over 19% below their 2025 peak from April–both typical of seasonal trends. Despite inventory gains, buyer activity was more subdued. Pending home sales, listings under contract, fell by 1.9% year-over-year, returning to negative territory after a flat reading in September.
Pace of Market Remains Slow
In October, the typical home spent 63 days on the market, which is five days longer than the same time last year. This marks the 19th straight month of homes taking longer to sell on a year-over-year basis, however, the gap has shrunk, falling below the one week mark for the first time since June. With a median of 63 days, homes are now selling three days faster than their October 2017-2019 norms after pacing in line with pre-pandemic norms in July through September. In short, time on market has returned to more historical normal levels, despite the fact that inventory still lags behind.
All four regions saw year-over-year increases in time on market, reflecting broader cooling trends: West: +8 days, South: +5 days, Midwest: +2 days and Northeast: +2 days. However, relative to pre-pandemic norms, only the West is seeing slower sales: West: 11 days slower, South: one day faster, Midwest: 14 days faster, and Northeast: 19 days faster.
List Prices Remain Flat Nationally
In September, the national median list price was $424,200, up 0.4% from last year and flat since last month. Price per square foot — a gauge of home values that accounts for the size of homes on the market — fell slightly (down 0.5% YoY, and -0.8% month-over-month).
Since October 2019, the typical list price has climbed 36.9%, while price per square foot is up 49.8%. These long-term increases have significantly affected affordability even before the impact of higher mortgage rates is considered. Most of these increases are a holdover from gains during the pandemic era. Since September 2022, the national median list price is unchanged, while price per square foot is up just 3.0% – despite a 46.1% increase in inventory and the median home staying on market for 13 days longer.