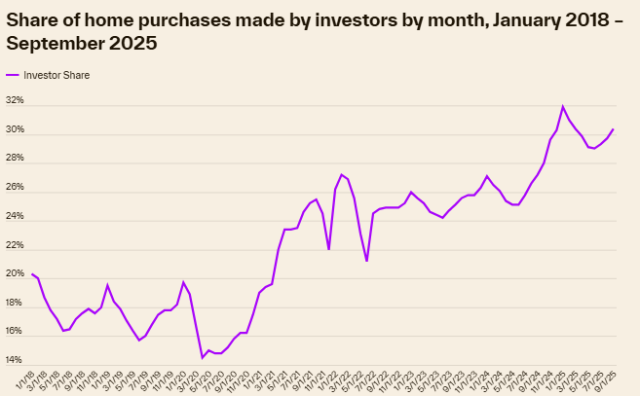
Property information, analytics, and data-enabled solutions provider Cotality has examined the state of the nation’s home investor marketplace in Q3 2025, reporting that investor activity rose from 29% in June 2025 to 30% in September 2025.
According to the Cotality Investor Purchase Indicator, this upward trend reveals that a lack of affordability has established an environment with less buyer competition, more choice in inventory, an increased willingness from sellers to entertain offers below list price, and a strong rental market. Bottom line, today’s market has become one where investors are stepping in to take advantage. Investor activity continues to build on an elevated market share they have controlled since late 2024 and represents a year-over-year increase of three percentage points.
“Investor activity followed its usual seasonal pattern. However, this latest surge is very different than the one seen in 2021 and 2022. During that period, rapid price appreciation persuaded investors to make aggressive offers and win bidding wars. Now, it makes more sense to wait until a home has been sitting on the market and negotiate a lower price,” said Thom Malone, principal economist at Cotality. “As sellers find it harder to sell at the price they want, inventory is accumulating and investors are taking advantage of the opportunity for discounts. Some sellers may choose to become landlords, but others might decide to take a small price cut and sell to an investor.”
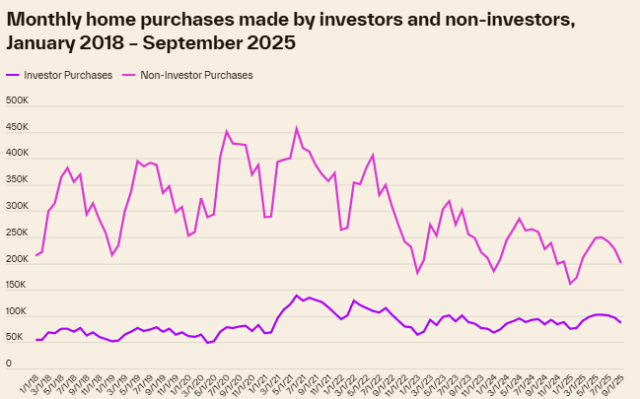
Both investors and owner-occupied buyers followed the typical seasonal pattern tracked in real estate, decreasing their purchase levels (as opposed to their share) in Q3 2025. Investor share, however, according to the Cotality Investor Purchase Indicator, continues to increase, but due largely to fewer owner-occupied buyers making purchases. Still, in terms of volume, investors are buying approximately 25% fewer homes than they were in 2021.
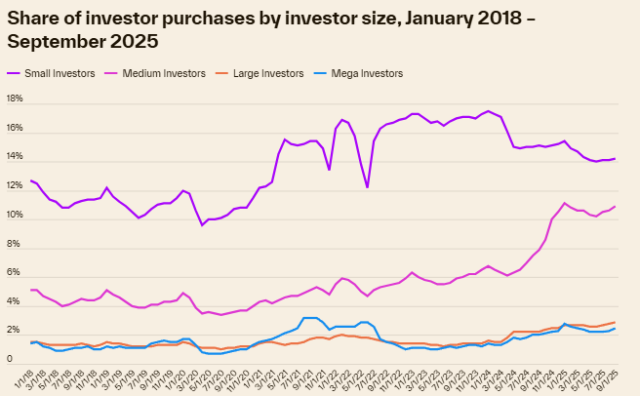
Medium-sized investors, classified as those owning 10–99 properties, were largely responsible for the increase in investor share in Q3. They went from making 10.2% of all single-family purchases in June 2025 to 10.9% in September 2025. Small investors (those investing in fewer than 10 properties) held mostly steady, making about 14% of investment purchases. Large investors (those investing in 101–1,000 properties) and mega investors (those investing in over 1,000 properties) were responsible for around 3% and 2.5% of purchases, respectively.
Medium investors are more likely to be cash buyers than small investors, and unlike large and mega investors, that often operate under the umbrella of larger institutional investors, are less likely to diversify into other assets. Furthermore, medium buyers are less likely to be flippers, and their buy-and-hold business model is a more appealing approach in the current environment.
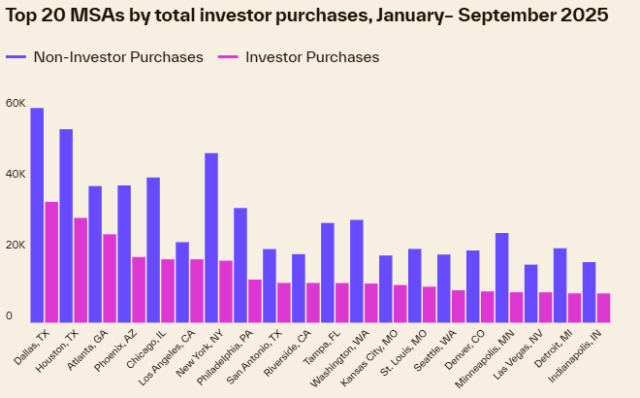
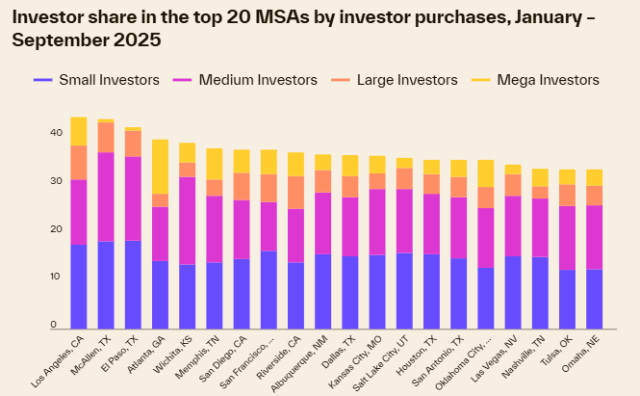
Investors continue to buy in areas of the U.S. with high population growth. Dallas, Houston, Atlanta, Phoenix, and Chicago are the top five cities where investors bought so far in 2025. Dallas and Houston also lead the nation for non-investor purchases. California metros like Los Angeles and Riverside remain an exception, generating strong investor interest, despite weaker or even negative population growth.
The number of homes investors buy and the share of total purchases they represent in an area are not necessarily correlated. Some metros like Los Angeles and Atlanta are high on both lists. However, while Phoenix and Chicago have high purchase volumes, neither metro ranks among the top 20 when looking at the share of total purchases that investors represent.
Instead, these major cities are outranked by smaller metros like McAllen and El Paso in Texas, and Wichita, Kansas where a larger-than-average presence of medium-sized investors inflates the investor share of total purchases.
El Paso and McAllen in Texas also have very few mega investors 一 not surprising since mega investors generally concentrate investments in large cities to build market dominance and benefit from economies of scale.
Cotality experts indicate that there is a possibility that investor share could surpass the previous record of 32% from January 2025. What remains to be seen is whether investors will increase their activity when owner-occupied buyers jump back into the market.
Cotality’s Investor Purchase Indicator is an investor purchase indicator, rather than an investment purchase indicator, meaning that it identifies purchases made by investors, but makes no judgement about what the property will be used for. For the analysis here, only arms-length purchases for single-family homes (detached and townhomes) were considered.