AT A GLANCE - Key Economic Events and Data released during August 2023
- Interest Rates: The 10-Year Treasury yield rose to 4.09% (Aug 31) from 3.97% (Jul 31).
- Housing: Existing Home Sales fell 2.2% (-16.6% YoY), New Home Sales rose 4.4% (+31.0% YoY), Pending Home Sales rose 0.9% (-14.0% YoY). Home Prices are up 1.0% to 3.0% YoY.
- Labor: The US Economy created 187,000 New Jobs during August and 157,000 in July. The Unemployment Rate rose to 3.8% in August from 3.5% in July. Wages increased by 4.3% YoY.
- Inflation: July CPI rose 0.2% (+3.2% YoY), and PCE rose 0.2% (+3.3% YoY).
- The Economy: US GDP grew by a 2.1% annualized rate in 2Q2023, up 2.6% YoY.
- Consumers: Retail Sales rose 0.7% (+3.2% YoY), Consumer Confidence and Sentiment fell.
- Stock Markets fell in August: Dow -2.4%, S&P -2.0%, Nasdaq -1.9%.
- Oil Prices rose 2.5% to $84/Barrel (Aug 31) from $82/Barrel (Jul 31).
- Interest Rates and Fed Watch
There was no FOMC Meeting in August, but there was the annual Jackson Hole Policy Symposium. Every year, economic heavyweights from around the world descend on Jackson Hole, Wyoming, to discuss the global economy and map out policy options for the following year. Fed Chair Jerome Powell wrapped up the conference with a speech reiterating what he has said all year. His opening comment was: "My message is the same ... getting inflation sustainably back down to 2% is expected to require a period of below-trend economic growth as well as some softening in the labor market conditions.”
FedSpeakTranslation: The Fed is committed to beating Inflation down to 2.0%, and they will keep Interest rates elevated for as long as it takes to do the job. They have to stop the wage-price spiral before it spins out of control. My guess is that the Fed wants to see unemployment above 4.0% before they start to ease monetary policy. The next FOMC meeting is Sept. 19 and 20.
- 10-Year Treasury Note Yield rose to 4.09% (Aug 31) from 4.02% (Jul 31).
- 30-Year Treasury Bond Yield rose to 4.20% (Aug 31) from 3.97% (Jul 31).
- 30-Year Fixed Mortgage rose to 7.18% (Aug 31) from 6.81% (Jul 27).
- 15-Year Fixed Mortgage rose to 6.55% (Aug 31) from 6.11% (Jul 27).
- Housing Market Data Released during August 2023
While the existing home market is starved of inventory, the new home market is clipping along at a brisk pace. Along with New Home Construction, Non-Residential Construction is going gang-busters. Why is Non-Residential Construction so strong? De-globalization. US companies are racing to on-shore manufacturing plants that they spent the last 30 years off-shoring. While there is a glut of empty office buildings, retail stores, and shopping malls, there is a shortage of manufacturing plants and industrial buildings. The Construction Industry (Residential and Non-Residential) is poised to be very healthy for the foreseeable future. In the meantime, Prices for Existing Homes continued to rise, up 1.0% to 3.0%.
Existing Home Sales (closed deals in July) fell 2.2% to an annual rate of 4,070,000 homes, down 16.6% in the last 12 months. 26% were all Cash Sales. The median price for all types of homes is $406,700 - up 1.9% from a year ago. The median Single-Family Home price is $412,300, up 1.6% YoY. The Median Condo price is $357,600, up 4.5% YoY. Homes were on the market for an average of 20 days, and 74% sold in less than a month. Currently, 1,110,000 homes are for sale, down 14.6% YoY.
New Home Sales (signed contracts in July) rose 4.4% to a seasonally adjusted annual rate of 714,000 homes, up 31.5% YoY. The median New Home price is $436,700 (down 12.0% from a peak of $496,800 in Oct 2022). The average price is $513,700 (down 9.0% from a peak of $568,700 in Dec 2022). There are 437,000 New Homes for sale, a 7.3-month supply.
Pending Home Sales Index (signed contracts in July) rose 0.9% to 77.6 from 76.8 the previous month, down 14.0% YoY.
Building Permits (issued in July) rose 0.1% to a seasonally adjusted annual rate of 1,442,000 units - down 13.0% YoY.
Single-Family Permits rose 0.6% to an annual pace of 930,000 homes, up 1.3% YoY.
Housing Starts (excavation began in July) rose 3.9% to an annual adjusted rate of 1,452,000, up 5.9% YoY. Single-
Family Starts rose 6.7% to 983,000 units, up 9.5% YoY.
Housing Completions (completed in July) fell 11.8% to an annual adjusted rate of 1,321,000 units - down 5.4% YoY.
Single-Family Completions rose 1.3% to an annual adjusted rate of 1,018,000 homes - up 1.4% YoY.
S&P/Case-Shiller 20 City Home Price Index rose 0.9% in June, down 1.2% YoY.
FHFA Home Price Index rose 0.3% in June, up 3.1% YoY.
Labor Market Economic Data Released during August and early September 2023
The Economy created 187,000 New Jobs during August and 157,000 in July. The US Labor Market is very robust, but it is slowing down. Jobs are plentiful but less plentiful than in the last few months. Job openings fell to 8,827,000 in July from 9,165,000 in June. The number of Job Openings has been slowly declining since reaching 11,700,000 in April 2022. That's 2,900,000 fewer Job Openings than 17 months ago. Analysts have been waiting for the data to reflect a softening Labor Market. So far, the Fed has been able to reduce Inflation and engineer a slow, orderly cooling of the Labor Market. If this continues, the Unemployment Rate could be above 4.0% sooner than expected.
- The Economy created 187,000 New Jobs during August and 157,000 in July.
- The Unemployment Rate rose to 3.8% in August from 3.5% in July and 3.6% in June.
- The Labor Force Participation Rate rose to 62.8 in August from 62.6% in July.
- The Average Hourly Wage rose 0.2% during August and 0.4% in July, up 4.3% YoY.
- Job Openings fell to 8,827,000 in July from 9,165,000 in June and 9,800,000 in May.
Inflation Economic Data Released during August 2023
This month's CPI shows that Inflation continues to cool down. Energy prices remain stubbornly high, which makes the Inflation fight more difficult. We're headed in the right direction, but there is a long way to go to hit the Fed's 2.0% target. Supply chain normalization has helped contain prices of imported Consumer goods, and lower lumber prices have helped with New Home Prices. Both sectors are key components of Core CPI. If Inflation continues to moderate, the Fed will stop raising Interest Rates and hold the current level for awhile.
CPI rose 0.2%, up 3.2% YoY | Core CPI rose 0.2%, up 4.7% YoY
PPI rose 0.3%, up 0.8% YoY | Core PPI rose 0.3%, up 2.4% YoY
PCE rose 0.2%, up 3.3% YoY | Core PCE rose 0.2%, up 4.2% YoY
GDP Economic Data Released during August 2023
The 2nd estimate for 2nd Quarter 2023 GDP showed the US Economy grew at a 2.1% annualized rate, up 2.6% YoY. Despite all the past Recession talk, people are becoming confident in the Economy and the ability of the Fed to engineer a Soft Landing. However, storm clouds are gathering - China's Economic problems, the Ukrainian War, Consumer Debt Levels, and the resumption of Student Loan Payments. Even with these issues lurking on the horizon, the US Economy continues to be a beacon of strength.
Consumer Economic Data Released during August 2023
The US Consumer is doing their part to support the Economy. Retail Sales rose 0.7% in July, up 3.2% in the last 12 months. However, Consumer Confidence and Sentiment took a hit in July. Much of the decline could be due to higher Gas Prices and rising Consumer Debt. US Credit Card Debt hit a new high of $1.0T - that's $1,000,000,000,000. Analysts speculate that Inflation is forcing many people to use Credit Cards to make ends meet. The insidious nature of Inflation is how it slowly eats away at purchasing power, which is taking a toll on Consumer Confidence.
- Retail Sales rose 0.7% during July, up 3.2% in the last 12 months.
- Consumer Confidence Index fell 6.9% to 106.1 from 114.0 the prior month, up 2.4% YoY.
- Consumer Sentiment Index (U of M) fell 2.9% to 69.5 from 71.6 the previous month.
- Energy, International, and Things You May Have Missed
- West Texas Intermediate Crude rose to $84/Barrel (Aug 31) from $82/Barrel (Jul 31).
- North Sea Brent Crude rose to $87/Barrel (Aug 31) from $85 /Barrel (Jul 31).
- Natural Gas rose to $2.75/MMBtu (Aug 31) from $2.65/MMBtu (Jul 31).
- Fitch Bond Rating Service downgraded US Securities from AAA to AA+, which caused a flurry of criticism and a jump in Interest Rates.
- Japan's 2Q2023 GPD surprised the Global Markets when it jumped to 6.0 YoY.
- The 2023 Hurricane season kicked off with Tropical storm Hilary hitting Southern California, and Hurricane Idalia hitting Florida, Georgia, and the Carolinas.
The Mortgage Economic Review is a concise summary of Key Economic Data that influences the Mortgage and Housing Markets. It's a quick read that keeps busy Professionals updated on important Economic Information. Feel free to share this with colleagues in the Mortgage, Housing, Finance, and Banking business. To have the Mortgage Economic Review emailed to you each month, click here.
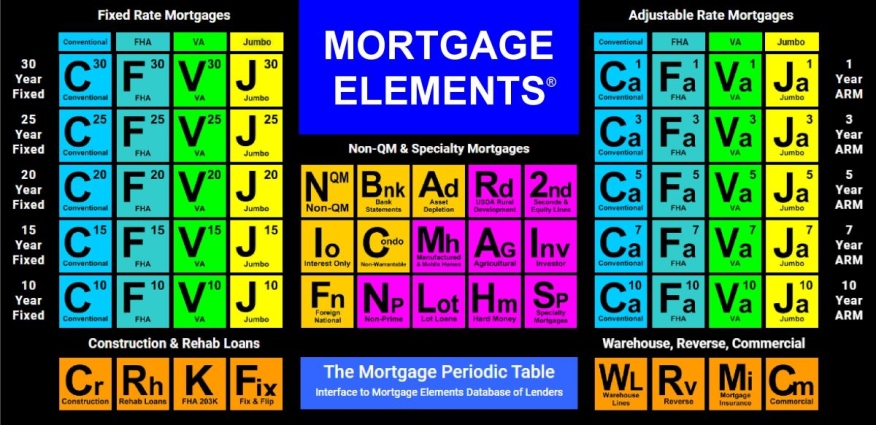
Discover New Lending Opportunities at MortgageElements.com, where you can explore over 300 Wholesale, Correspondent, Warehouse, Reverse, Construction, and Rehab Mortgage Lenders from one website. Use the Mortgage Periodic Table to research Mortgage Products and connect with TPO Account Executives. It costs nothing to use. It is one of the industry's largest databases of Wholesale, Correspondent, Warehouse, Rehab, and Construction Lenders.
The Mortgage Economic Review is for informational and educational purposes only and should not be construed as investment, legal, financial, or mortgage advice. The information is gathered from sources believed to be credible and may be opinion-based and editorial in nature. Mortgage Elements Inc does not guarantee or warrant its accuracy or completeness, and there is no guarantee it is without errors. This newsletter is for use by Mortgage, Housing, and Finance Professionals and is not an advertisement to extend credit or solicit mortgage originations. © Copyright 2023 Mark Paoletti, Mortgage Elements Inc, All Rights Reserved.