Home affordability has hit a 10-year low, according to the National Association of Home Builders (NAHB)
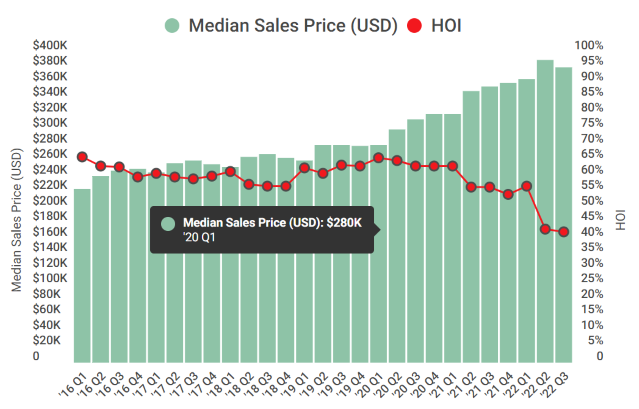
The NAHB/Wells Fargo Housing Opportunity Index (HOI), released Thursday shows families earning the U.S. median income of $90,000 could afford just 42.2% of the new and existing homes sold between the beginning of July and end of September. It was the second consecutive quarterly record low for housing affordability since the Great Recession, trailing the 42.8% mark set in the second quarter, NAHB said. The trade group has consistently tracked housing affordability since 2012.
The organization cited rising mortgage rates, ongoing building material supply chain disruptions, high inflation, and elevated home prices for pushing the housing market into a recession. With mortgage rates moving even higher in the fall, it added, affordability conditions are expected to worsen through the end of 2022.
“The housing market and affordability conditions have continued to weaken throughout the year as rising mortgage rates, supply chain bottlenecks and a lack of skilled construction workers continue to push housing costs higher,” said NAHB Chairman Jerry Konter, a home builder and developer from Savannah, Ga. “Entry-level buyers are particularly hurt, as more of them are getting priced out of the market.”
NAHB Chief Economist Robert Dietz said affordability concerns are a primary reason builder sentiment has declined for 10 straight months and why construction of single-family homes has continued to drop. Buyers also are pulling back because of rising interest rates, he added.
“The best way to reduce housing costs is to boost supply,” Dietz said. “Policymakers must prioritize fixing building material supply chains and easing excessive regulations to help bring down construction costs and enable home builders to increase housing production.”
According to the index, the national median home price fell to $380,000 in the third quarter, but that is still the second-highest median price in the index's history, below only the $390,000 median price in the second quarter.
Average mortgage rates, meanwhile, reached an index high of 5.72% in the third quarter, up from 5.33% in the second quarter, NAHB said.
Looking ahead, affordability will continue to weaken, NAHB said. That’s based on a report at the end of October from Freddie Mac, which said the 30-year fixed-rate mortgage had topped 7% for the first time since April 2002.
Top 5 Affordable Major Markets
Lansing-East Lansing, Mich., was the nation’s most affordable major housing market, defined as a metro with a population of at least 500,000. There, 84.4% of all new and existing homes sold in the third quarter were affordable to families earning the area’s median income of $89,500.
- Lansing-East Lansing, Mich.
- Indianapolis-Carmel-Anderson, Ind.
- Scranton-Wilkes-Barre, Pa.
- Toledo, Ohio
- Syracuse, N.Y.
Top 5 Affordable Small Markets
Cumberland, Md.-W.Va., was rated the nation’s most affordable small market, with 92.1% of homes sold in the third quarter being affordable to families earning the median income of $71,300.
- Cumberland, Md.-W.Va.
- Wheeling, W.Va.-Ohio
- Davenport-Moline-Rock Island, Iowa-Ill.
- Elmira, N.Y.
- Utica-Rome, N.Y.
Top 5 Least Affordable Major Markets
For the eighth straight quarter, Los Angeles-Long Beach-Glendale, Calif., remained the nation’s least affordable major housing market. There, just 3.7% of the homes sold during the third quarter were affordable to families earning the area’s median income of $91,100. All five markets are located in Calif.
- Los Angeles-Long Beach-Glendale
- Anaheim-Santa Ana-Irvine
- San Diego-Chula Vista-Carlsbad
- Oxnard-Thousand-Oaks-Ventura
- San Francisco-San Mateo-Redwood City
Top 5 Least Affordable Small Markets
At the very bottom of the affordability chart was Salinas, Calif., where 5.9% of all new and existing homes sold in the third quarter were affordable to families earning the area’s median income of $90,100. Again, all five markets are located in Calif.
- Salinas
- Napa
- Santa Cruz-Watsonville
- Santa Maria-Santa Barbara
- San Luis Obispo-Paso Robles
Please visit nahb.org/hoi for tables, historic data and details.