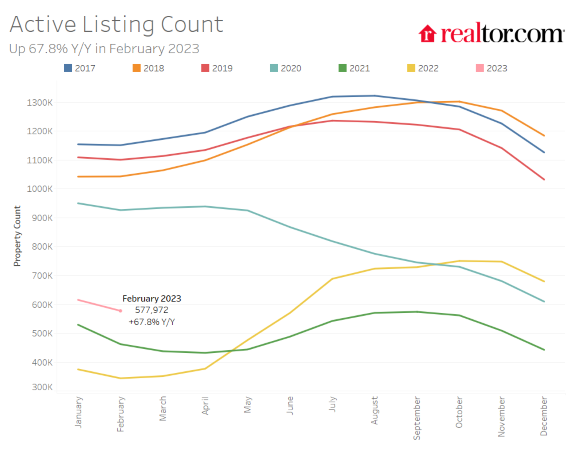
The inventory of homes for sale in the U.S. rose at a record annual pace for the sixth straight month in February, increasing 67.8% year over year, Realtor.com said Thursday.
Realtor.com’s Monthly Housing Trends report shows the housing market is continuing to rebalance, the company said.
Despite the significant increase in inventory over last year's record lows, home prices are still growing, though more slowly — 7.8% from a year earlier, a sign of still-high hopes from home sellers entering the market, Realtor.com said.
In a market with conditions that don't favor either buyers or sellers, both will likely have to make compromises to make a deal happen, the company said. As mortgage rates continue to fluctuate and increase the cost of buying a home, sellers need to price their home appropriately to attract buyers.
For buyers, they need to make the best offer they can on a home that fits their needs and budget, the company said.
"The number of homes for sale on the market is up significantly from a year ago, even though fewer homeowners have listed their home for sale in recent months,” said Danielle Hale, Realtor.com’s chief economist. “High home prices and mortgage rates continue to cut into buyer interest and homes are taking more than three weeks longer to sell than last year."
"With a smaller pool of buyers today and more competition from other homes on the market,” she added, “home-sellers will likely need to adjust their price expectations in the market this spring."
"Potential buyers looking to take advantage of more homes to choose from and a less-competitive pace also have more negotiating power than they did a year ago,” Clare Trapasso, executive news editor at Realtor.com, said. “So if a home has been on the market a while without receiving any offers, [buyers] may want the seller to contribute to their closing costs, make expensive repairs, or even buy down their mortgage rate."
February’s record year-over-year increase in the supply of homes for sale was driven mostly by low interest from buyers facing high home and mortgage costs, rather than an influx of new homes for sale to the market, Realtor.com said.
Despite a significant increase in the number of homes for sale in recent months as existing home sales and demand slow, there are still fewer homes available to buy nationwide on a typical day than there were a few years ago, it said.
Key Highlights
- In February, the U.S. supply of active listings for sale rose at a record annual pace for the sixth month in a row, up 67.8% compared to last year, but it is still well below pre-pandemic levels (-47.4% compared to the February 2017-19 average). Both newly-listed homes (-15.9%) and pending listings, or homes under contract with a buyer (-24.7%), declined year-over-year.
- Across the 50 largest metros, the number of homes for sale was up 86% from last February, with the most growth in active listings in the South (+141.4%).
- Among the 50 largest U.S. metros, 49 saw active inventory gains in February compared to last year, but only Las Vegas, and Austin and San Antonio, Texas, saw higher levels of inventory compared to typical February 2017–19 levels. Hartford, Conn. (-8.8%) was the only metro to see inventory decline on a year-over-year basis.
- Six metros saw the number of newly listed homes increase over last year, led by Raleigh, N.C. (+14.8%); Dallas (+10.3%); and San Antonio (+10.2%). The largest yearly decline in newly listed homes were in western metros, including San Jose, Calif. (-43.3%); San Francisco (-39.4%); and Seattle (-36.8%).
- Home price growth continues to level off as more sellers drop their asking price
While home prices were up in February compared to last year, year-over-year asking price growth has remained in the single digits for three months in a row, suggesting that home prices are continuing to moderate from last year's record highs, Realtor.com said.
While mortgage rates are down from their November highs, rates rebounded this month and with higher home prices compared to last February, the typical monthly mortgage payment is roughly $630 more than it was a year ago. As a result of these cost pressures, the slowdown in the demand for homes means more than twice as many sellers cut their asking price in February compared to last year, Realtor.com said.
Home Prices
- The U.S. median listing price was $415,000 in February, up from $406,000 in January, and 7.8% higher than a year ago.
- Among the 50 largest U.S. metros, the biggest annual listing price gains were in Midwest metros (+11.9%, on average). The metros with the biggest asking price increases were Milwaukee (+48.8%); Memphis, Tenn. (+42.7%); and Virginia Beach (+16.3%). However, in these metros the mix of inventory also changed and more larger, expensive homes are for sale today.
- In February, 13% of active listings had their price reduced, up from 5.4% a year ago. Southern metros (+10.3 percentage points) saw the largest increase in the share of listings with price reductions.
- Listing prices declined in eight markets, led by Austin (-8% year-over-year), New Orleans (-7%), and Pittsburgh (-6.9%). In those markets, the median price-per-square-foot also declined on a yearly basis, signaling that price declines weren't from a rise in smaller homes for sale but by sellers adjusting their expectations and sales price.
Time On Market
The housing market has cooled considerably since the height of the pandemic, when buyer demand outmatched the record low supply of homes for sale and bidding wars were common.
In February, homes took more than three weeks longer to sell than they did at this time last year, despite an uptick in buyer sentiment in January. The continued slower pace of home sales signals a return to a more balanced housing market and what was considered normal before the pandemic, and it gives buyers more time to decide if a house is right for them, Realtor.com said.
- The typical home spent 67 days on market in February, 23 days longer than this time last year, but still 20 days faster than in February 2017-2019, on average.
- Relative to the national pace, time on market was lower across the 50 largest U.S. metros in February (56 days, on average) and was 19 days slower than the February 2022 pace.
- Compared to last year, 47 of 50 metros saw an increase in time on market, with larger metros in the West seeing the greatest increase (+26 days). Austin (+52 days); Raleigh, N.C. (+51 days); and Las Vegas and Denver (+38 days) saw the greatest increases in time on market.
- Only one market saw shrinking time on market and two were unchanged from last year: Hartford (-2 days); Cincinnati (+0 days); and Buffalo, N.Y. (+0 days).