For the first time in at least eight years, the typical home isn’t selling for more than it would have a year earlier, according to a new report from Redfin.
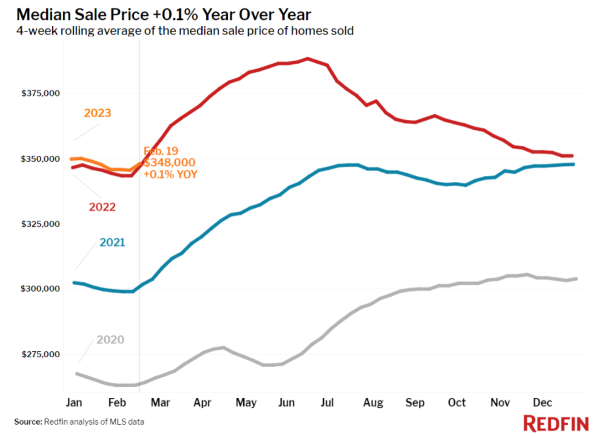
The technology-powered real estate brokerage said Thursday that the median U.S. home-sale price for the four weeks ended Feb. 19 was $348,000, essentially unchanged (+0.1%) year over year.
That’s the first time that’s happened since at least 2015, when the data for its report begins, Redfin said.
Prices are close to falling on a year-over-year basis because serious homebuyers are scarce as mortgage rates approach the high-6% range. Freddie Mac reported Thursday that the 30-year fixed-rate mortgage averaged 6.5% this week.
As a result of rising rates, mortgage-purchase applications dropped to their lowest level since 1995 last week. As stubbornly high inflation caused rates to jump, it is pricing many would-be buyers out of the market, Redfin said.
The typical monthly mortgage payment nationwide is $2,486 with today’s average rate, just $20 shy of October’s record high and up 26% year over year, the report said. A homebuyer with a $2,500 monthly budget can afford a $384,000 home, compared with the $518,000 home that same buyer could have purchased with the 3% rates common in 2021, it said.
That, Redfin noted, leaves sellers with just one option to lure buyers: Lower their asking price.
Early indicators of homebuying demand show there are still plenty of people searching for homes, with online searches of homes for sale and home tours up from the end of last year. But those home searchers are holding off on applying for a mortgage and making offers.
“Affordability is weighing heavily on would-be buyers, with the uptick in mortgage rates and still-high prices giving them pause,” said Redfin Deputy Chief Economist Taylor Marr. “More people will take the plunge and buy the homes they’re looking at online and in person when housing costs come down enough to fit their budget. But we don’t know when that will happen; where mortgage rates go from here depends largely on inflation.”
She added that, “When inflation does slow down enough to bring rates back down, there’s a pool of sidelined buyers who will be waiting to jump back in. Those buyers will still be limited by a lack of homes for sale, though–new listings are down by double digits.”
Redfin’s Leading Indicators Of Homebuying Activity:
- For the week ended Feb. 23, average 30-year fixed mortgage rates rose to 6.5%, marking the third straight week of increases. The daily average was 6.82% on Feb. 23.
- Mortgage-purchase applications during the week ended Feb. 17 declined 18% from a week earlier, seasonally adjusted, reaching their lowest level since 1995. Purchase applications were down 41% year over year.
- The seasonally adjusted Redfin Homebuyer Demand Index — a measure of requests for home tours and other homebuying services from Redfin agents — was up 2% from a week earlier and 9% from a month earlier during the week ended Feb. 19. It was down 25% YOY.
- Google searches for “homes for sale” were up about 18% from their November low during the week ended Feb. 18, but down about 23% YOY.
- Touring activity as of Feb. 21 was up 14.1% from the start of the year, compared with an 18% increase at the same time last year, according to home tour technology company ShowingTime.
Key Takeaways for 400+ U.S. Metros:
Unless otherwise noted, the data in Redfin’s report covers the four-week period ending February 19. Redfin’s weekly housing market data goes back through 2015.
- The median home sale price was $348,000, essentially flat (+0.1%) from a year earlier and the smallest increase since at least 2015. The next-smallest increase was when prices rose 0.3% YOY in June 2020.
- Median sale prices fell in 21 of the 50 most populous U.S. metros. The biggest drops were in Oakland, Calif. (-9.7% YoY); Austin, Texas (-9.5%); Sacramento (-7.1%; Phoenix (-6.6%); and San Jose, Calif. (-6%). Prices increased most in Columbus, Ohio (+12.2%); Milwaukee (11.9%); West Palm Beach, Fla. (9.8%); Miami (9.3%); and Indianapolis (8.5%).
- The median asking price of newly listed homes was $381,561, up 1.1% YOY, the smallest increase since May 2020.
- The monthly mortgage payment on the median-asking-price home was $2,486 at a 6.5% mortgage rate, the current weekly average. That’s just $20 (-1%) below the October 2022 peak. Monthly mortgage payments are up 26% ($513) YOY.
- Pending home sales were down 17.4% YOY, the smallest decline in over five months with the exception of the prior four-week period.
- Among the 50 most populous U.S. metros, pending sales fell most in Las Vegas (-55.6% YoY), Austin (-49.4%), Nashville (-46.8%), Riverside, CA (-46.4%) and Phoenix (-45.9%). Pending sales rose in one metro: Chicago (18.2%).
- New listings of homes for sale fell 18.8% year over year. New listings declined in all 50 of the most populous U.S. metros, with the biggest declines in Sacramento (-43.2% YoY); Oakland (-42.5%); San Jose (-38.9%); Portland, Ore. (-38.4%); and Seattle (-37.7%).
- Active listings (the number of homes listed for sale at any point during the period) were up 21.1% YOY, the smallest increase in two months.
- Months of supply — a measure of the balance between supply and demand, calculated by the number of months it would take for the current inventory to sell at the current sales pace — was 3.8 months, down from 4.3 months a month earlier and up from 2.1 months a year earlier.
- Homes that sold were on the market for a median of 51 days, up from 32 days a year earlier and the record low of 18 days set in May.
- 21% of homes sold above their final list price, down from 41% a year earlier.
- On average, 5% of homes for sale each week had a price drop, up from 2% a year earlier.