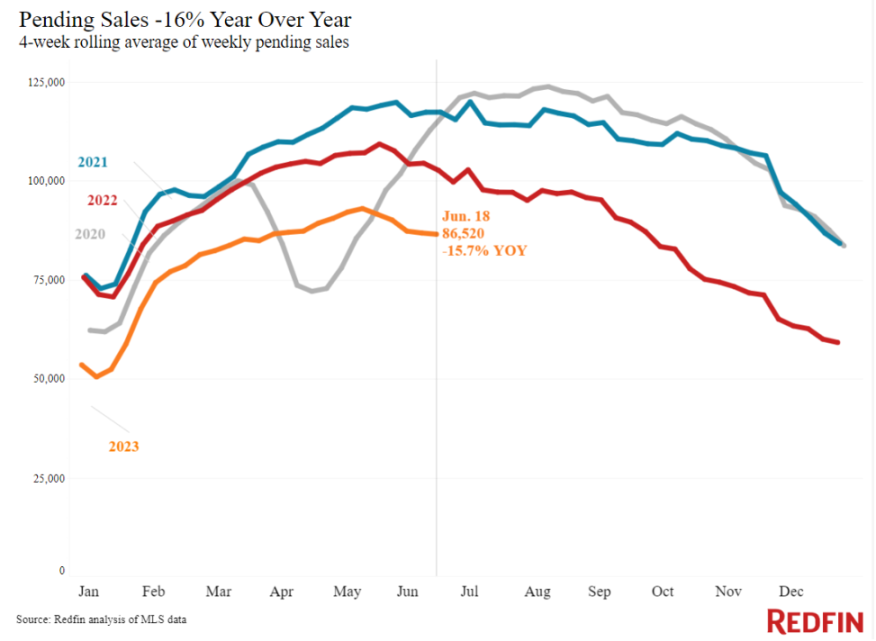
Spring is supposed to be the hot season for home sales, but a new report from Redfin says that wasn’t the case in 2023.
In fact, the digital real estate brokerage says the spring homebuying season didn’t happen. Instead of the calendar determining the homebuying season, it says, the Federal Reserve is dictating when people buy and sell — and so far, the Fed's actions suggest they should wait.
Pending home sales fell 16% from a year earlier during the four weeks ended June 18, but even though sales are relatively tepid, Redfin said its Homebuyer Demand Index — a measure of requests for tours and other early-stage buying services from Redfin agents — was up 11% year over year.
In addition, there were more house hunters than there were homes hitting the market. New listings of homes for sale were down 24% from a year ago, and the total number of homes for sale was down 8%, the biggest drop in over a year, Redfin said.
High mortgage rates are responsible for the drops in both demand and supply. With average rates sitting above 6% all spring, pushing the typical U.S. monthly housing payment up near record highs, many would-be buyers are sitting on the sidelines, waiting for rates to come down, the report states.
The buyers who are out there are having a hard time finding listings, with many prospective sellers staying put, hanging onto their relatively low rates — nearly all homeowners with a mortgage have a rate below 6%.
The continuing inventory shortage is bolstering home prices. The median U.S. home-sale price dropped just 1% year over year this week, the smallest decline in more than three months, Redfin said. Locally, prices have started leveling off, falling in 25 of the 50 most populous metros, compared with 29 a month ago. In San Jose, Calif., for instance, the median sale price is up roughly 2% year over year, marking the first increase after eight straight months of declines.
“There are two things that would jumpstart the housing market: A big drop in mortgage rates and/or a big surge of new listings,” said Redfin Deputy Chief Economist Taylor Marr. “Neither of those things happened this spring; instead, rates rose and new listings dropped to record lows. And with one or two more interest-rate hikes expected this year, mortgage rates are likely to remain elevated at least through the summer, continuing to limit both demand and supply.”
Marr said that even though there wasn’t much of a spring homebuying season, there was a spring building season. “That means there’s hope for more listings somewhat soon, with homebuilders working to fill the inventory bucket,” he said. “Builders broke ground on more single-family homes in May than almost any month in nearly two decades, which could expand buyers’ options by the end of the year.”
Leading Indicators Of Homebuying Activity:
- The daily average 30-year fixed mortgage rate was 6.9% on June 21, down from a half-year high of 7.14% a month earlier. For the week ended June 15, the average was 6.69%, down slightly from 6.71% the week before but still close to the highest rate since November.
- Mortgage-purchase applications during the week ended June 16 rose 2% from a week earlier, seasonally adjusted, marking the second straight week of increases. Purchase applications were down 32% from a year earlier.
- The seasonally adjusted Redfin Homebuyer Demand Index was down slightly from a week earlier during the week ended June 18. It was up 11% from a year earlier, the fourth consecutive annual increase. Demand was dropping at this time in 2022 as mortgage rates rose.
- Google searches for “homes for sale” were up 13% from a month earlier during the week ended June 17, and down about 11% from a year earlier.
- Touring activity as of June 18 was up 14% from the start of the year, compared with a 4% decrease at the same time last year, according to home tour technology company ShowingTime. Tours increased slowly during this time last year as mortgage rates shot up.
Key Housing Market Takeaways:
Unless otherwise noted, this data covers the four-week period ended June 18. Redfin’s weekly housing market data goes back through 2015. For bullets that include metro-level breakdowns, Redfin analyzed the 50 most populous U.S. metros. Select metros may be excluded from time to time to ensure data accuracy.
- The median home sale price was $382,861, down 1% from a year earlier, the smallest decline in more than three months. Price declines have been shrinking for the last two months.
- Home-sale prices declined in 25 metros, with the biggest drops in Austin, Texas (-11% year over year), Las Vegas (-9.1%), Detroit (-8%), Los Angeles (-7.1%), and Phoenix (-6.8%).
- Sale prices increased most in Fort Lauderdale, Fla. (8.6%), Miami (8.5%), Providence, R.I. (5.5%), Milwaukee (5.2%), and Virginia Beach (5.1%).
- The median asking price of newly listed homes was $397,225, up 0.3% YoY.
- The monthly mortgage payment on the median-asking-price home was $2,628 at a 6.69% mortgage rate, the average for the week ended June 15. That’s down slightly from the record high hit three weeks earlier, but up 8% ($190) from a year earlier.
- Pending home sales were down 15.7% year over year, continuing a 13-month streak of double-digit declines.
- Pending home sales fell in all metros Redfin analyzed. They declined most in Milwaukee (-28% YoY), Providence (-26.3%), Seattle (-25.6%), Portland, Ore. (-24.8%), and San Diego (-23.4%).
- New listings of homes for sale fell 24% YoY, roughly on par with the declines over the last two months.
- New listings declined in all metros Redfin analyzed. They fell most in Las Vegas (-42.3% YoY), Phoenix (-42%), Oakland, Calif. (-38.8%), Seattle (-37.4%), and San Diego (-36.2%).
- Active listings (the number of homes listed for sale at any point during the period) dropped 8.1% from a year earlier, the biggest drop in over a year. Active listings were up slightly from a month earlier; typically, they post month-over-month increases at this time of year.
- Months of supply — a measure of the balance between supply and demand, calculated by the number of months it would take for the current inventory to sell at the current sales pace — was 2.5 months, the lowest level in nearly a year. Four to five months of supply is considered balanced, with a lower number indicating seller’s market conditions.
- 32.9% of homes that went under contract had an accepted offer within the first two weeks on the market, down from 36% a year earlier.
- Homes that sold were on the market for a median of 27 days, the shortest span since August. That’s up from a near-record low of 19 days a year earlier.
- 36.3% of homes sold above their final list price, the highest share since last August but down from 53% YoY.
- On average, 5.3% of homes for sale each week had a price drop, up from 4.8% a year earlier.
- The average sale-to-list price ratio, which measures how close homes are selling to their final asking prices, was 100%. That means homes are selling for exactly their asking price, on average, for the first time in 10 months. That’s down from 102.2% a year earlier.