Don't underestimate the landlord next door — mom-and-pop investors are reported to have over 90% market share
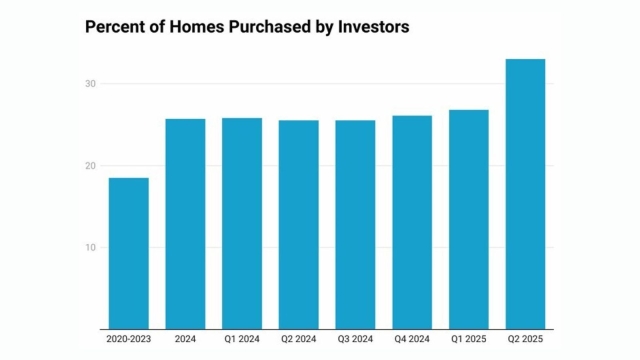
Real estate investors purchased 33% of single-family homes sold in the second quarter of 2025, the highest share in five years, according to new data from BatchData, a real estate data platform. But the real story lies in who is doing the buying.
Despite headlines about Wall Street landlords, the market remains overwhelmingly controlled by small investors. Owners of just one to five properties account for 87% of all investor-owned homes, the report found. Another 4% belong to those with six to ten properties. By contrast, large institutional players with portfolios exceeding 1,000 homes control only 2% of the market.
“The perception that institutional investors are gobbling up the nation’s housing stock is overstated,” BatchData said in releasing the report.
This surge is largely driven by "mom-and-pop" investors focusing on lower-priced single-family homes, despite larger institutions being net sellers. Source: BatchData
Even as investor share has risen, the total number of homes sold to investors actually fell: about 16,000 fewer properties changed hands in Q2 compared with a year earlier, underscoring how slower overall sales volumes can inflate investors’ market share. Investors now own about 20% of the nation’s 86 million single-family homes.
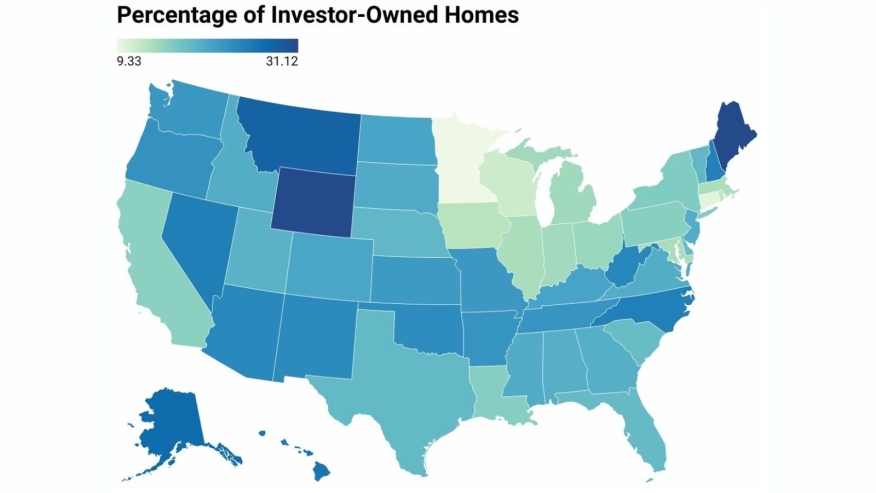
Geographically, the largest pools of investor-owned homes are in Texas (1.46 million), California (1.33 million), and Florida (1.1 million). States with the highest percentage of single-family homes owned by investors include Hawaii (26%), Alaska (27%), Montana (31%), and Maine (31%).
Get the NMP Daily
Essential stories, every weekday.
Investors are also buying below market averages. In Q2, they paid about $455,000 per property, compared with a national average price of $512,800. Large institutional buyers operate in even lower tiers, with average purchase prices closer to $280,000.
The report highlights another key trend: investor-to-investor transactions remain a major force. More than half of investor sales in Q2 went to other investors, though large operators are increasingly net sellers. The biggest players sold 5,801 properties while buying just 4,069, marking their sixth straight quarter of net dispositions.
Still, BatchData noted, nearly 45% of investor sales in Q2 went back to traditional homebuyers, putting homes back into the broader market.
Employers added just 29,000 jobs in September, sending Treasury yields lower and offering a potential counterweight to the recent rise in mortgage rates
The September jobs report gave the mortgage market something it hasn't had much of lately: downward pressure on Treasury yields.U.S. employers added just 29,000 jobs in September, while the unemployment rate edged up to 4.2%, according to the Bureau of Labor Statistics. The ...
The wholesale lender is adopting a new identity three years after acquiring Homepoint’s wholesale business and rising to No. 4 in industry rankings
The Loan Store has a new name after a three-year expansion that transformed the once-small wholesale lender into one of the largest players in the broker channel.The Tucson, Arizona-based lender has rebranded as Averra Financial Inc., effective immediately, the company annou...
Employers added just 29,000 jobs in September, sending Treasury yields lower and offering a potential counterweight to the recent rise in mortgage rates
The typical down payment fell 9% from a year ago, while shifting market conditions are giving originators different affordability conversations across the country
New-home sales rose 6.4% in August as builders cut prices, offered incentives, and sold more lower-priced homes. Now mortgage rates are moving against buyers again
ServiceLink finds 45% of surveyed LOs cite borrower reluctance as a barrier, even though most recent buyers say digital options would influence their choice of mortgage provider