United Van Lines released its annual study that uses exclusive data to track customers' state-to-state migration patterns. Today, the company's 45th Annual National Movers Study indicated that Americans were on the move in lower-density areas and to be closer to their families throughout the last year.
The study found that Vermont had the highest percentage of inbound migration (74%). Topping the list of outbound migrations was New Jersey (71%), which has held that spot for the past four years.
The following states that had the most inbound migrations were South Dakota (69%), South Carolina (63%), West Virginia (63%) and Florida (62%). Meanwhile, Illinois (67%), New York (63%), Connecticut (60%) and California (59%), which regularly have appeared at the top of the outbound list in recent years, again ranked among the states with the largest exodus.
Motivations and Influences
In addition to collecting state-by-state data, United Van Lines also issues an accompanying survey to analyze the motivations and influences of Americans’ interstate moves. The results indicated that 31.8% of Americans who moved did so in order to be closer to their family — a new trend coming out of the pandemic, as priorities and lifestyle choices shift.
Also, 32.5% of Americans moved for a new job or job transfer, which is a significant decrease from 2015 when more than 60% of Americans cited a job or transfer.
"This new data from United Van Lines is indicative of COVID-19's impact on domestic migration patterns, with 2021 bringing an acceleration of moves to smaller, mid-sized towns and cities," said Michael A. Stoll, economist and professor in the Department of Public Policy at the University of California, Los Angeles. "We're seeing this not only occur because of Americans' desire to leave high-density areas due to risk of infection, but also due to the transformation of how we're able to work, with more flexibility to work remotely.”
Another trend emerging from the pandemic is that many Gen Xers are beginning to retire (often at a younger age than past generations) joining the baby boomer generation. While many are retiring to states like Florida, United Van Lines' data reveals they’re not necessarily rushing to busy cities like Orlando or Miami. Instead, they’re venturing to less populated areas like Punta Gorda (81% inbound), Sarasota (79% inbound) and Fort Myers-Cape Coral (77% inbound).
In Oregon, a similar trend emerged, with retirees moving to cities including Medford-Ashland and Eugene-Springfield, which saw 83% and 79% inbound migration in 2021, respectively.
"For 45 years now, our annual United Van Lines study, with its data-driven insights, has allowed us to explore a deeper understanding of Americans' overall migration patterns," said Eily Cummings, director of corporate communications at United Van Lines. "As the pandemic continues to impact our day-to-day, we're seeing that lifestyle changes — including the increased ability to work from home — and wanting to be closer to family are key factors in why Americans are moving today."
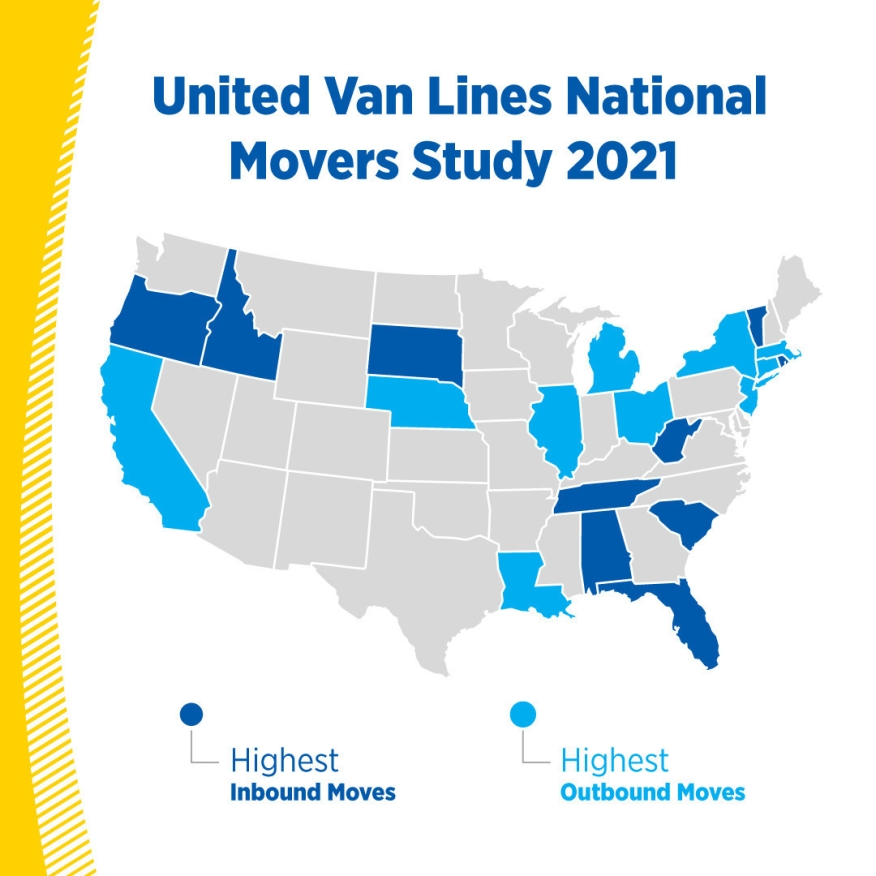
The top inbound states of 2021 were:
- Vermont
- South Dakota
- South Carolina
- West Virginia
- Florida
- Alabama
- Tennessee
- Oregon
- Idaho
- Rhode Island
Six out of these 10 states — including Vermont, South Dakota, West Virginia, Alabama, Oregon and Idaho — are among the 20 least-dense states in the country, with fewer than 100 people per square mile.
The top outbound states for 2021 were:
- New Jersey
- Illinois
- New York
- Connecticut
- California
- Michigan
- Massachusetts
- Louisiana
- Ohio
- Nebraska
Nine out of the top 10 states are considered densely populated, illustrating America’s shift to less crowded states.