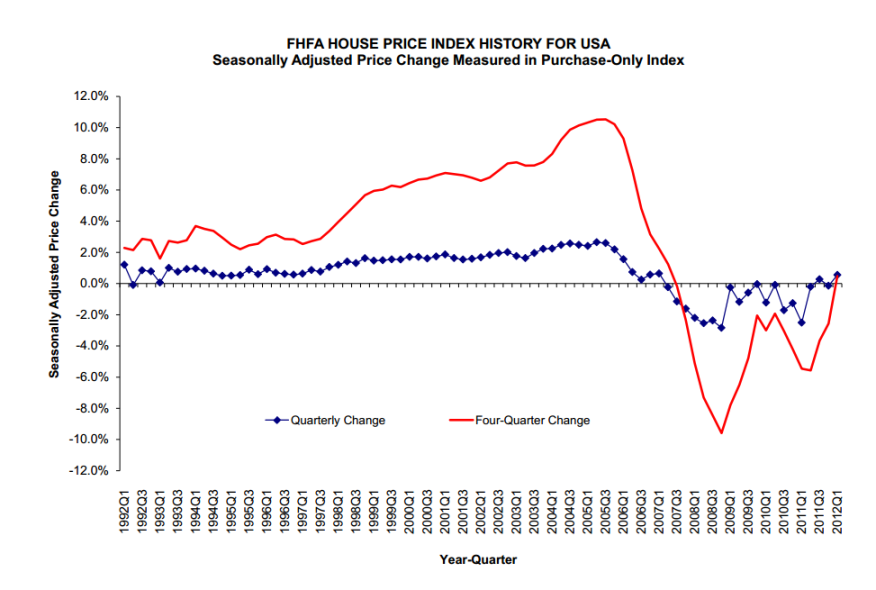
U.S. house prices rose modestly in Q1, according to the Federal Housing Finance Agency’s (FHFA) seasonally adjusted purchase-only house price index (HPI). The FHFA HPI was up 0.6 percent on a seasonally adjusted basis since Q4 of 2011. The HPI is calculated using home sales price information from Fannie Mae and Freddie Mac mortgages. Seasonally adjusted house prices rose 0.5 percent from Q1 of 2011 to the first quarter of 2012. FHFA’s seasonally adjusted monthly index for March was up 1.8 percent from February.
“Consistent with other housing market indicators, the FHFA HPI showed stronger house prices in the first quarter, most notably in March,” said FHFA Principal Economist Andrew Leventis. “Increased affordability and a somewhat smaller inventory of homes for sale are positively impacting house prices.”
FHFA’s expanded-data HPI, a metric introduced in August 2011 that adds transactions information from county recorder offices and the Federal Housing Administration (FHA) to the HPI data sample, rose 0.2 percent over the latest quarter. Over the latest four quarters, the index is down 1.3 percent. While the national, purchase-only house price index rose 0.5 percent from the first quarter of 2011 to Q1 of 2012, prices of other goods and services rose 3.2 percent over the same period. Accordingly, the inflation-adjusted price of homes fell approximately 2.6 percent over the latest year.
Significant findings of the study include:
►The seasonally adjusted purchase-only HPI rose in the first quarter in 30 states and the District of Columbia.
►The top five annual increases were Hawaii (10.3 percent), Washington, DC (9.8 percent), Iowa (5.7 percent), Florida (4.7 percent) and North Dakota (4.4 percent).
►Of the nine census divisions, the Mountain division experienced the strongest prices in the latest quarter, posting a 1.4 percent price increase. Prices were weakest in the New England division, where prices fell -0.7 percent.
►As measured with purchase-only indexes for the 25 most populated metropolitan areas in the U.S., Q1 price increases were greatest in the Houston-Sugar Land-Baytown, Texas area. That area saw price increases of 2.4 percent between Q4 of 2011 and Q1 of 2012. Prices were weakest in Atlanta-Sandy Springs-Marietta, Ga., where prices declined 3.3 percent over that period.