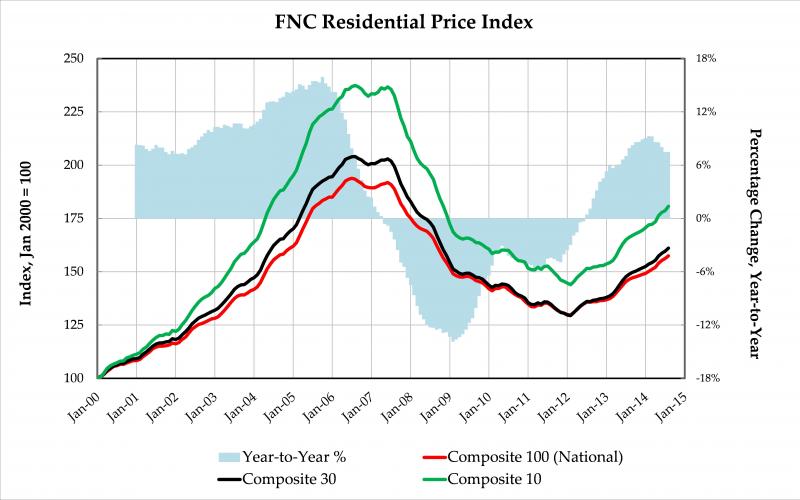
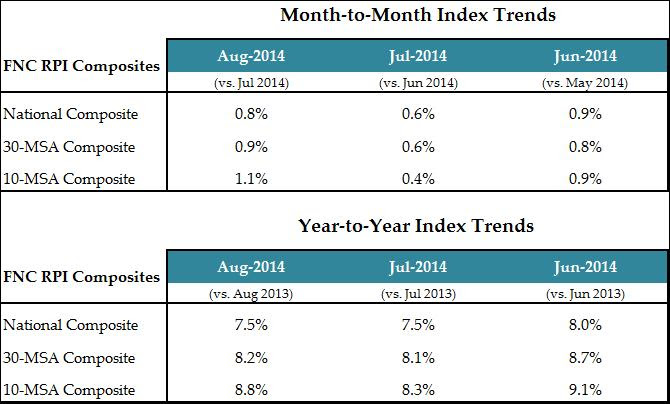
The latest FNC Residential Price Index (RPI) shows U.S. home prices have increased another 0.8 percent from July to August. The latest trend—as of August—marks a 30-month rising streak since 2012. Based on recorded sales of non-distressed properties (existing and new homes) in the 100 largest metropolitan areas, the index increased 7.5 percent from the same period in 2013—unchanged when compared to July’s year-to-year rate—amid a persistent slowdown in the annual rate of home price appreciation.
As of August, completed foreclosures comprise about 11 percent of total existing home sales. In the for-sale market, preliminary data from September and October shows that the average asking price discount and time-on-market (TOM) have hardly changed in the last six months: the discount is only slightly above two percent, while the TOM remains at about three months.
FNC’s RPI is the mortgage industry’s first hedonic price index built on a comprehensive database that blends public records of residential sales prices with real-time appraisals of property and neighborhood attributes. As a gauge of underlying home values, the RPI excludes final sales of real estate-owned (REO) and foreclosed homes, which are frequently sold with large price discounts, likely reflecting poor property conditions.
The table below shows the seasonally unadjusted rates of month-to-month and year-to-year changes in the FNC national index, a 100-MSA composite index, as well as two narrower indices, 30- and 10-MSA composites. The 30- and 10-MSA composites were up 0.9 percent and 1.1 percent respectively in August, rising at a much faster pace than in July—leading to a slight uptick in the two indices’ year-to-year change at 8.2 percent and 8.8 percent, respectively.
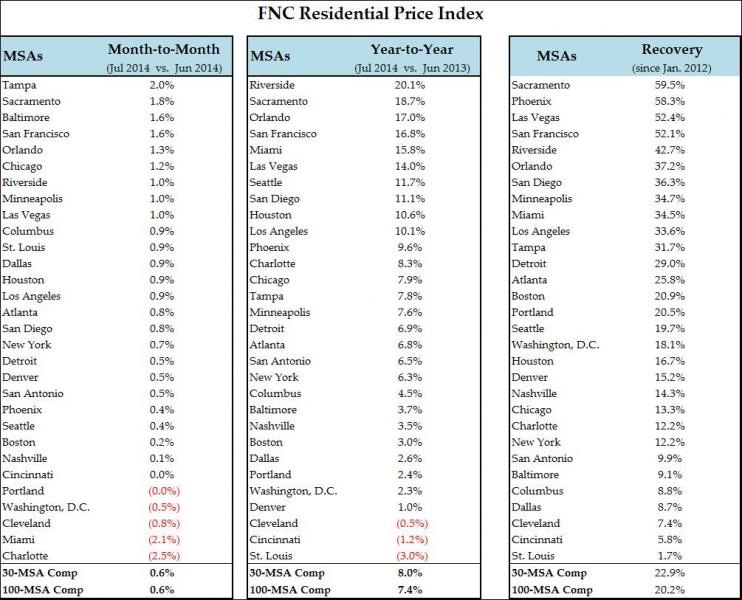
The chart below shows the latest price trends for each MSA in the FNC Composite 30, tabulated separately based on month-to-month, year-to-year, and 2012-to-date cumulative price recovery.
Prices were up in 22 of the 30 cities tracked by the FNC 30-MSA composite index, led by Cleveland (2.6 percent), Los Angeles (2.6 percent), Dallas (2.5%), and Columbus, OH (2.1%). Orlando, St. Louis, and New York also showed a strong August month, rising 1.9%, 1.8%, and 1.8% respectively. The Sacramento and San Francisco markets took an unexpected turn, down 2.6% and 2.1%, respectively. This is the first time since the recovery took hold in February 2012 that home prices in San Francisco declined from the previous month. A third California city—Riverside—also recorded nearly a half percentage decline.
On a year-to-year basis, a third of the cities in the FNC 30-MSA composite index continue to see home prices appreciating rapidly, ranging from 9.6 percent in Phoenix to 17.4 percent in Riverside. Only Cincinnati and St. Louis continue to show year-to-year price declines.