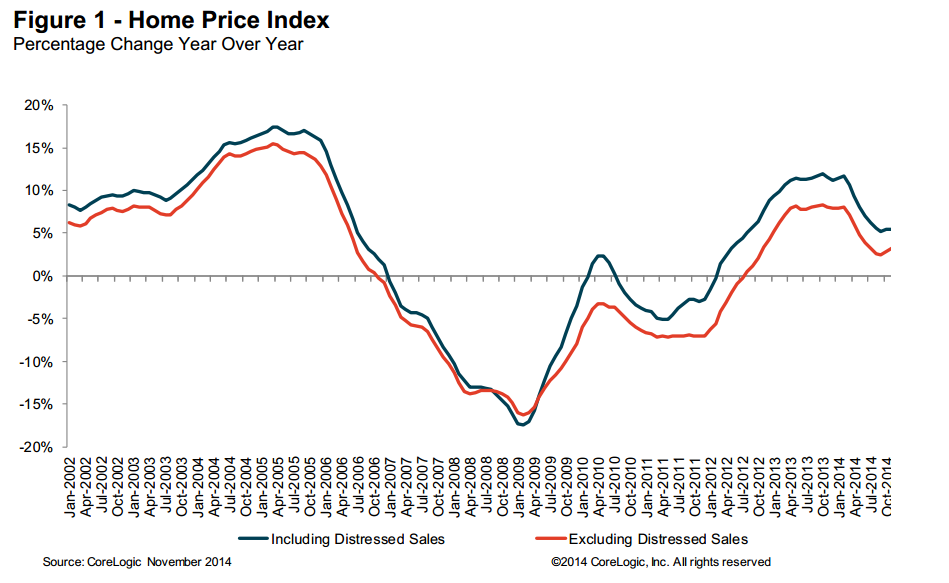
CoreLogic has released its November 2014 CoreLogic Home Price Index (HPI) report. Home prices nationwide, including distressed sales, increased 5.5 percent in November 2014 compared to November 2013. This change represents 33 months of consecutive year-over-year increases in home prices nationally. On a month-over-month basis, home prices nationwide, including distressed sales, rose by 0.1 percent in November 2014 compared to October 2014. At the state level, including distressed sales, all states and the District of Columbia showed year-over-year home price appreciation in November. Twenty-nine states are at or within 10 percent of their peak. Seven states reached new highs in the home price index (since January 1976 when the index starts); these states were: Colorado, North Dakota, Oklahoma, South Dakota, Tennessee, Texas and Wyoming.
Excluding distressed sales, home prices nationally increased 5.3 percent in November 2014 compared to November 2013 and 0.3 percent month over month compared to October 2014. Also excluding distressed sales, all states and the District of Columbia showed year-over-year home price appreciation in November. Distressed sales include short sales and real estate-owned (REO) transactions.
The CoreLogic HPI Forecast indicates that home prices, including distressed sales, are projected to decrease 0.1 percent month over month from November 2014 to December 2014 and increase, on a year-over-year basis, by 4.6 percent from November 2014 to November 2015. Excluding distressed sales, home prices are also expected to decrease by 0.1 percent month over month from November 2014 to December 2014 and increase by 4.2 percent year over year from November 2014 to November 2015. The CoreLogic HPI Forecast is a monthly projection of home prices using the CoreLogic HPI and other economic variables. Values are derived from state-level forecasts by weighting indices according to the number of owner-occupied households for each state.
“After decelerating for most of the year, home price growth has been holding firm between a five percent and six percent growth rate for the last four months,” said Sam Khater, deputy chief economist at CoreLogic. “However, pockets of weakness are clear in Baltimore and Washington, D.C., and three of the top four states with the highest price appreciation are energy intensive and had been benefitting from the energy boom which is currently receding as oil prices trend downward. These states—Texas, Colorado and North Dakota, may see some downward pressure on prices in 2015.”
“The pace of home price gains have slowed as we exit 2014 but this is probably only a temporary lull,” said Anand Nallathambi, president and CEO of CoreLogic. “While the CoreLogic HPI Forecast shows a slight dip in prices next month, we believe that prices will be up a year from now as continued economic growth fuels buyer confidence and their willingness to purchase a home and invest in their future.”
Highlights as of November 2014:
►Including distressed sales, the five states with the highest home price appreciation were: Michigan (+9.0 percent), Colorado (+8.8 percent), Texas (+8.5 percent), North Dakota (+7.9 percent) and Nevada (+7.9 percent).
►Excluding distressed sales, the five states with the highest home price appreciation were: Massachusetts (+8.6 percent), Texas (+7.9 percent), Colorado (+7.8 percent), North Dakota (+7.8 percent) and South Dakota (+7.5 percent).
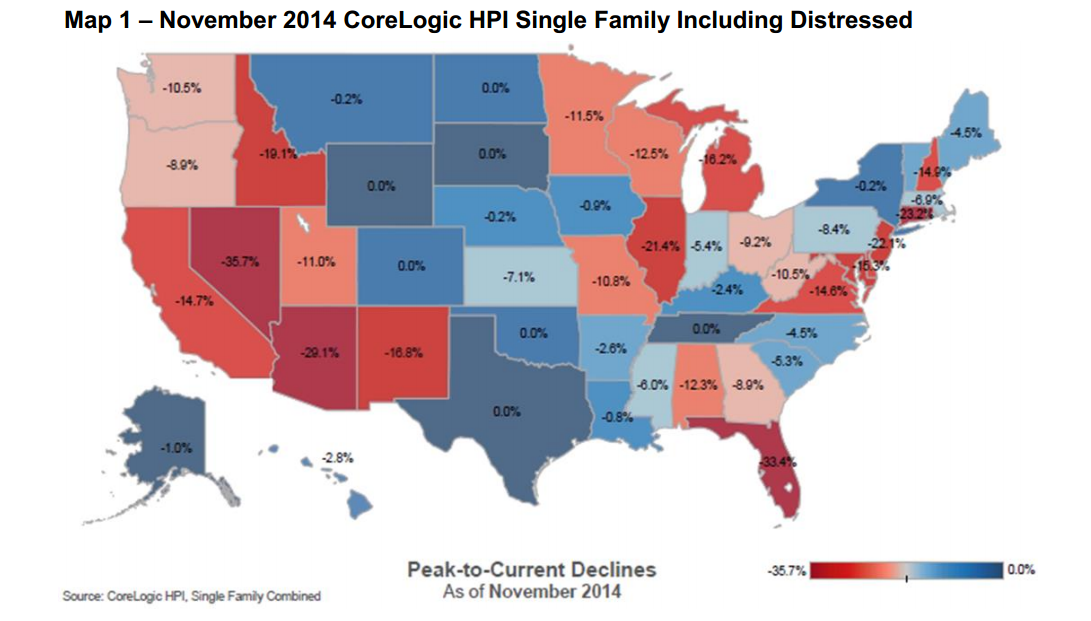
►Including distressed transactions, the peak-to-current change in the national HPI (from April 2006 to November 2014) was -12.9 percent. Excluding distressed transactions, the peak-to-current change in the HPI for the same period was -9.2 percent.
►Including distressed sales, the 5-year HPI change (from November 2009 to November 2014) is 18.9 percent.
►The five states with the largest peak-to-current declines, including distressed transactions, were: Nevada (-35.7 percent), Florida (-33.4 percent), Arizona (-29.3 percent), Rhode Island (-29.1 percent) and Connecticut (-23.2 percent).
►Including distressed sales, the U.S. has experienced 33 consecutive months of year-over-year increases; however, the national increase is no longer posting double-digits.
►Ninety-six of the top 100 Core Based Statistical Areas (CBSAs) measured by population showed year-over-year increases in November 2014. The four CBSAs that showed year-over-year declines were: Baltimore-Columbia-Towson, Md.; Camden, N.J.; Greensboro-High Point, N.C.; and Winston-Salem, N.C.