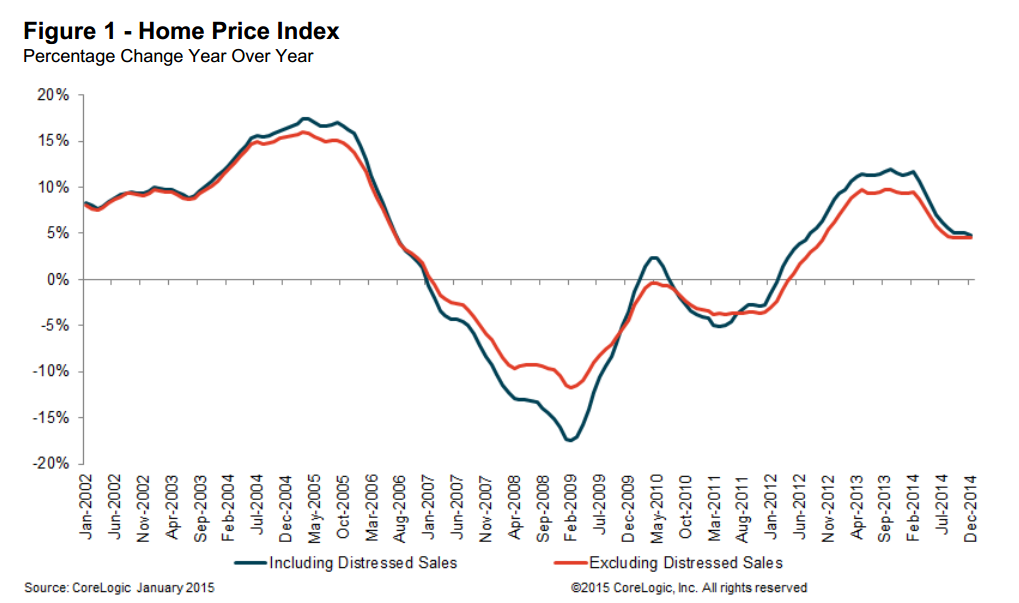
CoreLogic has released its January 2015 CoreLogic Home Price Index (HPI) which shows that home prices nationwide, including distressed sales, increased 5.7 percent in January 2015 compared to January 2014. This change represents 35 months of consecutive year-over-year increases in home prices nationally. On a month-over-month basis, home prices nationwide, including distressed sales, increased by 1.1 percent in January 2015 compared to December 2014.
Including distressed sales, 27 states and the District of Columbia are at or within 10 percent of their peak. Four states, New York (+5.6), Wyoming (+8.3 percent), Texas (+8.3 percent) and Colorado (+9.1 percent), reached new highs in the home price index since January 1976 when the index starts. Excluding distressed sales, home prices increased 5.6 percent in January 2015 compared to January 2014 and increased 1.4 percent month over month compared to December 2014. Also excluding distressed sales, all states and the District of Columbia showed year-over-year home price appreciation in January. Distressed sales include short sales and real estate-owned (REO) transactions.
The CoreLogic HPI Forecast indicates that home prices, including distressed sales, are projected to increase 0.4 percent month over month from January 2015 to February 2015 and, on a year-over-year basis, by 5.3 percent from January 2015 to January 2016. Excluding distressed sales, home prices are expected to increase 0.3 percent month over month from January 2015 to February 2015 and by 4.9 percent year-over-year from January 2015 to January 2016. The CoreLogic HPI Forecast is a monthly projection of home prices using the CoreLogic HPI and other economic variables. Values are derived from state-level forecasts by weighting indices according to the number of owner-occupied households for each state.
“House price appreciation has generally been stronger in the western half of the nation and weakest in the mid-Atlantic and northeast states,” said Dr. Frank Nothaft, chief economist at CoreLogic. “In part, these trends reflect the strength of regional economies. Colorado and Texas have had stronger job creation and have seen eight to nine percent price gains over the past 12 months in our combined indexes. In contrast, values were flat or down in Connecticut, Delaware and Maryland in our overall index, including distressed sales.”
“We continue to see a strong and progressive uptick in home prices as we enter 2015. We project home prices will continue to rise throughout the year and into 2016,” said Anand Nallathambi, president and CEO of CoreLogic. “A dearth of supply in many parts of the country is a big factor driving up prices. Many homeowners have taken advantage of low rates to refinance their homes, and until we see sustained increases in income levels and employment they could be hunkered down so supplies may remain tight. Demand has picked up as low mortgage rates and the cut in the FHA annual insurance premium reduce monthly payments for prospective homebuyers.”
Highlights as of January 2015:
►Including distressed sales, the five states with the highest home price appreciation were Colorado (+9.1 percent), Michigan (+9.0 percent), Texas (+8.3 percent), Wyoming (+8.3 percent) and Nevada (+7.6 percent).
►Excluding distressed sales, the five states with the highest home price appreciation were Colorado (+8.1 percent), Nevada (+7.9 percent), Texas (+7.8 percent), Massachusetts (+7.7 percent), and Oregon (+7.4 percent).
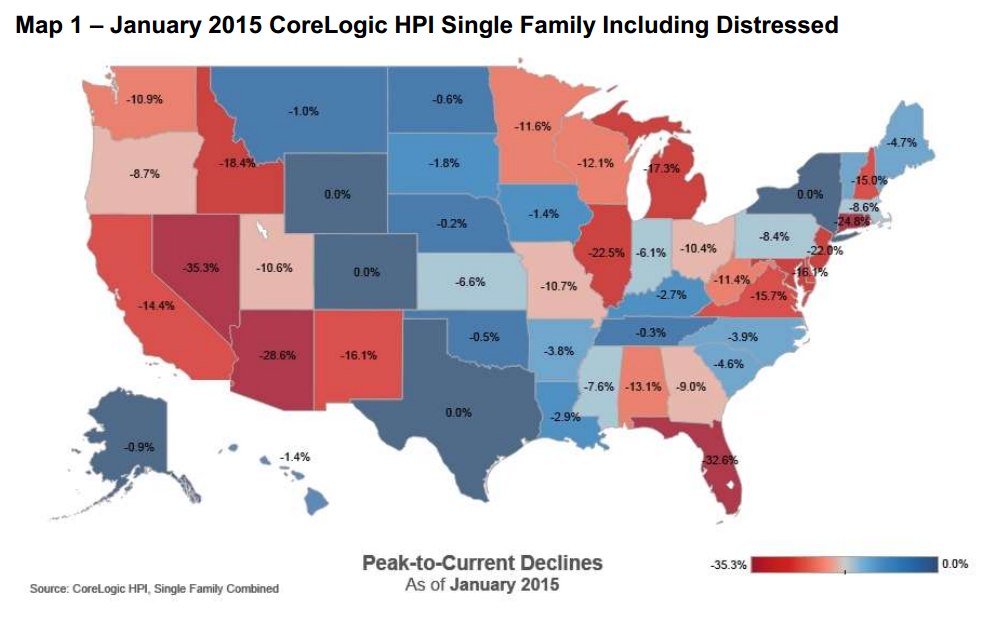
►Including distressed transactions, the peak-to-current change in the national HPI (from April 2006 to January 2015) was -12.7 percent. Excluding distressed transactions, the peak-to-current change in the HPI for the same period was -8.6 percent.
►Including distressed sales, only Maryland and Connecticut showed negative home price appreciation at -0.3 percent and -1.9 percent respectively. The five states with the largest peak-to-current declines, including distressed transactions, were Nevada (-35.3 percent), Florida (-32.6 percent), Rhode Island (-29.9 percent), Arizona (-28.6 percent) and Connecticut (-24.8 percent).
►Including distressed sales, the U.S. has experienced 35 consecutive months of year-over-year increases; however, the national increase is no longer posting double-digits.
►Ninety-four of the top 100 Core Based Statistical Areas (CBSAs) measured by population showed year-over-year increases in January 2015. The six CBSAs that showed year-over-year declines were New Orleans-Metairie, La.; Bridgeport-Stamford-Norwalk, Conn.; Rochester, N.Y.; Baltimore-Columbia-Towson, Md.; Wilmington, Del.-Md.-N.J.; and Hartford-West Hartford-East Hartford, Conn.