Q1 Permanent Loan Mods Outpace Foreclosure Sales

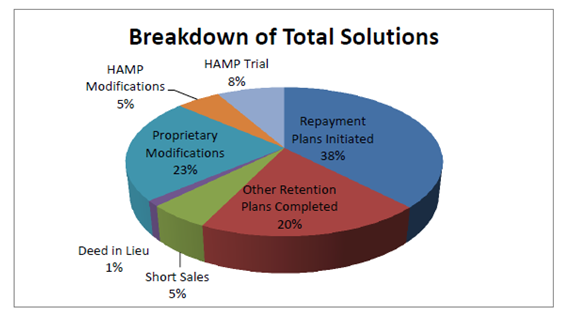
HOPE NOW has released its Q1 2015 data, which shows that approximately 444,000 homeowners received non-foreclosure solutions from mortgage servicers in January, February and March. Permanent loan modifications totaled approximately 116,000 and short sales totaled 24,000. Other solutions (including repayment plans, deeds in lieu, other retention plans and liquidation plans) made up the rest of the total number. When homeowners do not qualify for long term permanent loan modifications, mortgage servicers continue to look for short term options that, in many cases, lead to a permanent solution.
Of the 116,000 loan modifications completed for the first quarter of 2015, about 87,000 homeowners received proprietary loan modifications and 29,101 homeowners received loan modifications completed under the Home Affordable Modification Program (HAMP). Month over month, proprietary loan modifications showed a consistent trend in Q1 2015.
“Activity on mortgage solutions remained robust during the first quarter of the year," said Eric Selk, executive director for HOPE NOW. "Permanent loan mods continue to slightly outpace foreclosure sales and total non-foreclosure solutions remain at a steady pace."

For Q1 2015, the combination of total loan modifications, short sales, deeds-in-lieu and workout plans outpaced foreclosure sales by a significant margin (approximately 444,000 solutions vs. 96,000 foreclosure sales). For every one foreclosure sale completed on a property, there were approximately 4.625 solutions offered for other properties. The availability of a combination of long term and short term workout tools has allowed for mortgage servicers to consider the viability of all retention and liquidation options before a foreclosure sale becomes the only course of action.
Q1 2015 vs. Q4 2014
►During the first quarter of 2015, there were an estimated 116,000 loan modifications completed, compared to 108,000 during the previous quarter—an increase of approximately seven percent.
►Serious delinquencies of 60 days or more declined from 1.93 million in 4Q 2014 to 1.86 million in 1Q 2015—a four percent decline (delinquency data is extrapolated from data received by the Mortgage Bankers Association for the Q1 2015).
Other key metrics for Q1 2015 vs. Q4 2014
►Total non-foreclosure solutions were approximately 444,000 in Q1 2015, compared to 447,000 in Q4 2015—virtually unchanged.
►Foreclosure starts were approximately 225,000 in Q1 2015, compared to 205,000 in Q4 2014, an increase of approximately 10 percent.
►Foreclosure sales in Q1 2015 were approximately 96,000, compared to the same number in Q4 2014—unchanged.
The 96,000 foreclosure sales in the first quarter of 2014 compares to an estimated 126,000 completed during the first quarter of 2014, representing a significant decline year-over-year.
Here are some other key metrics for Q1 2015 vs. Q1 2014
►Total solutions for Q1 2015 were approximately 444,000 vs. 509,000 for Q1 2014—a decline of 13 percent.
►Loan mods for Q1 2015 were approximately 116,000 vs. 142,000 for Q1 2014—a decline of 18 percent.
►Foreclosure starts for Q1 2015 were approximately 225,000 vs. 219,000 for Q1 2014—an increase of three percent.
►Short sales completed for Q1 2015 were approximately 24,000 vs. 36,000 for Q1 2014—a decline of 33 percent.
►Deeds in lieu for Q1 2015 were approximately 6,100—a decline of 18% from Q1 2014 (7,400).
►Delinquencies of 60-plus days were approximately 1.86 million for Q1 2015, compared to 2.11 million for Q1 2014—a decline of 12 percent.
Key Data Points
For the month of March, mortgage servicers offered approximately 154,000 total solutions. There were an estimated 43,000 permanent loan modifications completed. Of that total, approximately 35,000 were proprietary loan modifications and 8,262 were completed under HAMP. Total modifications for the month represented a 15 percent increase from the previous month (38,000).
Of the proprietary loan modifications completed in March 2015, approximately 69 percent (24,000) had reduced monthly principal and interest payments of more than 10 percent.
Other key metrics for the month of March 2015 compared to February 2015:
►Foreclosure sales were estimated at 31,000 in March vs. 28,000 in February—an increase of 11 percent.
►Foreclosure starts were estimated at 78,000 in March vs. 66,000 in February—an increase of 17 percent.
►Short sales completed were approximately 8,300 in March vs. 7,500 in February—an increase of 11 percent.


