CoreLogic has released its May 2015 CoreLogic Home Price Index (HPI) which shows that home prices nationwide, including distressed sales, increased by 6.3 percent in May 2015 compared with May 2014. This change represents 39 months of consecutive year-over-year increases in home prices nationally. On a month-over-month basis, home prices nationwide, including distressed sales, increased by 1.7 percent in May 2015 compared with April 2015. Including distressed sales, 33 states and the District of Columbia were at or within 10 percent of their peak prices in May 2015. Ten states and the District of Columbia reached new price peaks not experienced since January 1976 when the CoreLogic HPI started. These states include Alaska, Colorado, Iowa, Nebraska, New York, North Carolina, Oklahoma, Tennessee, Texas and Vermont.
Excluding distressed sales, home prices increased by 6.3 percent in May 2015 compared with May 2014 and increased by 1.4 percent month over month compared with April 2015. Excluding distressed sales, only Massachusetts (-2 percent) and Louisiana (-0.2 percent) showed year-over-year depreciation in May. Distressed sales include short sales and real estate-owned (REO) transactions.
The CoreLogic HPI Forecast indicates that home prices, including distressed sales, are projected to increase by 0.9 percent month over month from May 2015 to June 2015 and by 5.1 percent on a year-over-year basis from May 2015 to May 2016. Excluding distressed sales, home prices are projected to increase by 0.8 percent month over month from May 2015 to June 2015 and by 4.7 percent year-over-year from May 2015 to May 2016. The CoreLogic HPI Forecast is a projection of home prices using the CoreLogic HPI and other economic variables. Values are derived from state-level forecasts by weighting indices according to the number of owner-occupied households for each state.
“Mortgage rates on 30-year fixed-rate loans remained below 4 percent through May, helping to fuel home-purchase activity,” said Frank Nothaft, chief economist for CoreLogic. “Our homes-for-sale listing data shows that markets with high demand and limited supply, such as San Francisco, are recording double-digit appreciation rates over the past year.”
“The rate of home price appreciation ticked up in May with gains being fairly widely distributed across the country. Importantly, higher home prices over the past couple of years have spurred increases in new single-family construction,” said Anand Nallathambi, president and CEO of CoreLogic. “Sales of newly built homes during the first five months of 2015 were up 23 percent from a year ago, and as rising values build equity for homeowners, we expect to see more existing homes offered for sale in the coming year.”
Highlights as of the May report include:
►Including distressed sales, the five states with the highest home price appreciation were: South Carolina (+10.3 percent), Colorado (+9.8 percent), Washington (+8.8 percent), Florida (+8.7 percent) and Nevada (+8.3 percent).
►Excluding distressed sales, the five states with the highest home price appreciation were: South Carolina (+9.6 percent), Colorado (+9.2 percent), Florida (+8.9 percent), Washington (+8.5 percent) and Oregon (+7.9 percent).
►Including distressed sales, only five states experienced home price depreciation including: Massachusetts (-4.8 percent), Connecticut (-1.8 percent), Maryland (-1.5 percent), Mississippi (-1.4 percent) and Louisiana (-0.8 percent).
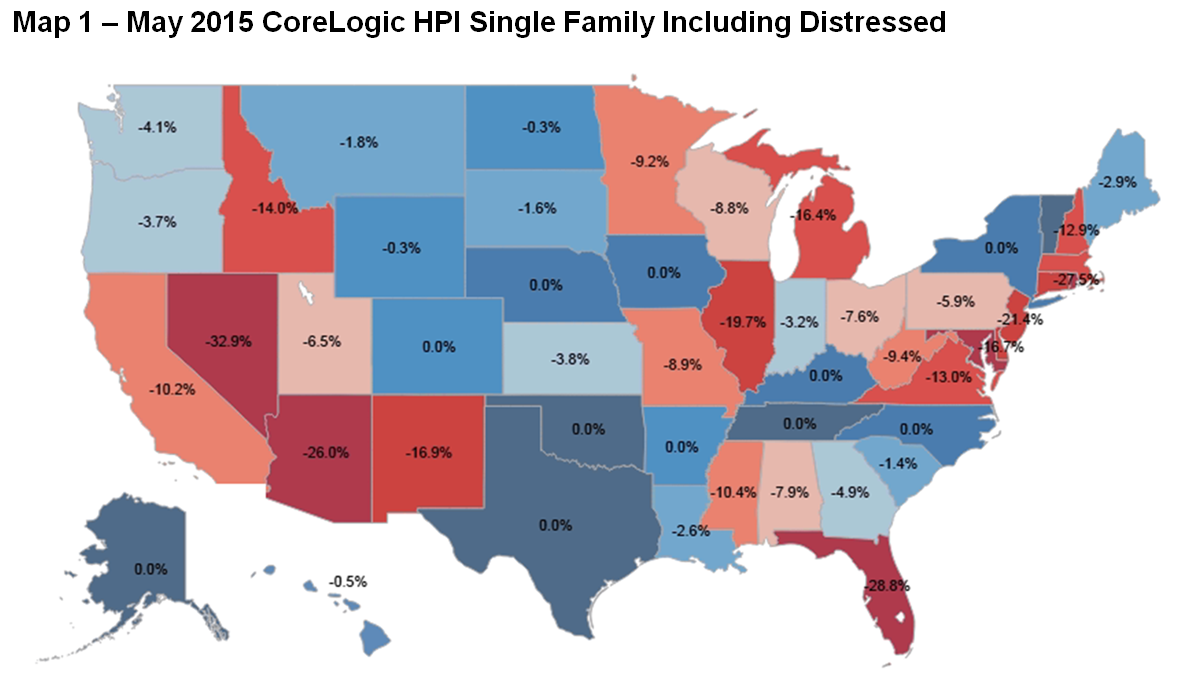
►Including distressed transactions, the peak-to-current change in the national HPI (from April 2006 to May 2015) was -8.4 percent. Excluding distressed transactions, the peak-to-current change for the same period was -4.7 percent.
►The five states with the largest peak-to-current declines, including distressed transactions, were: Nevada (-32.9 percent), Florida (-28.8 percent), Rhode Island (-27.5 percent), Arizona (-26 percent) and Maryland (-23.1 percent).
►Of the top 100 Core Based Statistical Areas (CBSAs) measured by population, 92 showed year-over-year increases. The eight CBSAs that showed year-over-year declines were: Baltimore-Columbia-Towson, MD (-1.8 percent); Boston, MA (-4.8 percent); Bridgeport-Stamford-Norwalk, CT (-0.32 percent); Cambridge-Newton-Framingham, MA (-2.9 percent); Camden, NJ (-0.96 percent); New Orleans-Metairie, LA (-6.4 percent); Silver Spring-Frederick-Rockville, MD (-0.31 percent) and Worcester, MA-CT (-6.6 percent).