The latest housing data is offering a strange environment where more than one-third of U.S. markets are recording record high home prices while negative equity is still dragging down a substantial percentage of homeowners.
RealtyTrac’s latest U.S. Home Sales Report, which analyzed 94 major metro areas, found 33 markets (35 percent) reached new all-time home price peaks in October, as the median sales price of U.S. single family homes and condos hit $207,500, up one percent from the previous month and up 10 percent from a year ago. October was the 44th consecutive month with a year-over-year increase in median home prices and the greatest year-over-year percentage increase since February 2014.
Eighty-four of the 94 metro areas analyzed for this report saw an increase in sales prices from the previous year, while only 10 metros saw a decline. The greatest annual median sales price were found in Detroit (up 29 percent), Charleston, S.C., and Denver (both up at 17 percent), Denver (up 17 percent), St. Louis (up 16 percent) and Bridgeport, Conn., and Cape Coral, Fla. (both up at 15 percent).
“Home sellers are sitting pretty in this market, realizing an average profit-since-purchase of 16 percent—the highest in any month since December 2007, on the cusp of the Great Recession,” said Daren Blomquist, vice president at RealtyTrac.
However, many of these purchases came without the assistance of mortgage professionals. October’s level of cash sales marked the third consecutive month of increases, with all-cash transactions accounting for 28.9 percent of purchase, up slightly 28.4 percent in the previous month but under the 30.4 percent level of a year ago.
But for many existing homeowners, the autumn was a somewhat dismal season. Zillow reported that 13.4 percent of homeowners owed more on their mortgage than their home is worth in the third quarter – and while this level is down from 14.4 percent last quarter, and 16.9 percent a year ago, Zillow acknowledged that negative equity was one of the most persistent reminders of the housing market crash and subsequent economic misery brought by the Great Recession.
"Negative equity has become almost an afterthought in a handful of the nation's hottest markets, but is holding back the recovery in dozens of large markets nationwide," said Zillow Chief Economist Svenja Gudell. "Despite steady declines in negative equity, many cities are still facing tight inventory, especially among entry-level homes. Those homes that are available are often not in demand and stay on the market for a long time. This can be extremely frustrating for buyers and sellers alike, as they come face to face with the difficult side effects of negative equity."
Las Vegas, which registered the highest negative equity rate in the country for the past four and a half years, continued to hold that sorry title, with a 22.1 percent negative equity rate in the third quarter. Chicago came in second with 20.6 percent, followed by Atlanta (18.6 percent), St. Louis (17.6 percent) and Baltimore (16.9 percent).
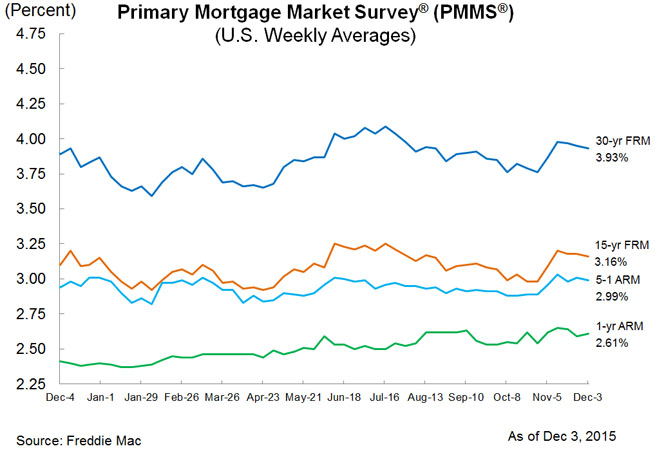
As for today’s market, Freddie Mac’s Primary Mortgage Market Survey (PMMS) for the week ending Dec. 3 finds the average 30-year fixed-rate mortgage (FRM) declining for the third consecutive week, averaging 3.93 percent—last week it averaged 3.95 percent, but a year ago at this time, it was at a lower 3.89 percent average. The 15-year FRM this week averaged 3.16 percent, down from last week’s 3.18 percent, but up from last year’s 3.10 percent.
The five-year Treasury-indexed hybrid adjustable-rate mortgage (ARM) averaged 2.99 percent this week, down from last week’s 3.01 percent but up from last year’s 2.94 percent. And the one-year Treasury-indexed ARM averaged 2.61 percent this week, down from 2.59 percent last week but from last year’s 2.41 percent.