Today’s housing data numbers reaffirm a situation that has become the new normal: Home sales and home prices are showing no signs of declining.
New home sales of new single-family houses in March were at a seasonally adjusted annual rate of 621,000, according to estimates released by the U.S. Census Bureau and the Department of Housing and Urban Development. Last month’s sales level was 5.8 percent above the revised February rate of 587,000 and 15.6 percent higher than the March 2016 estimate of 537,000. The median sales price of new houses sold in March was $315,100 and the average sales price was $388,200. The seasonally-adjusted estimate of new houses for sale at the end of March was 268,000, which represents a supply of 5.2 months at the current sales rate.
Separately, the latest S&P CoreLogic Case-Shiller Indices tracked home prices across February. The
S&P CoreLogic Case-Shiller U.S. National Home Price NSA Index found a 5.8 percent annual gain in February, up from the 5.6 percent level in January. February’s level marked a 32-month high for this index. The 10-City Composite posted a 5.2 percent annual increase, up from five percent in the previous month, while the 20-City Composite reported a year-over-year gain of 5.9 percent, up from 5.7 percent in January.
Before the seasonal adjustment, the National Index posted a month-over-month gain of 0.2 percent in February while the 10-City Composite posted a 0.3 percent increase and the 20-City Composite reported a 0.4 percent rise. After the seasonal adjustment, the National Index recorded a 0.4 percent month-over-month increase, the 10-City Composite posted a 0.6 percent increase and the 20-City Composite reported a 0.7 percent month-over-month uptick. Sixteen of 20 cities reported increases in February before the seasonal adjustment, while 19 cities saw prices rise after the seasonal adjustment.
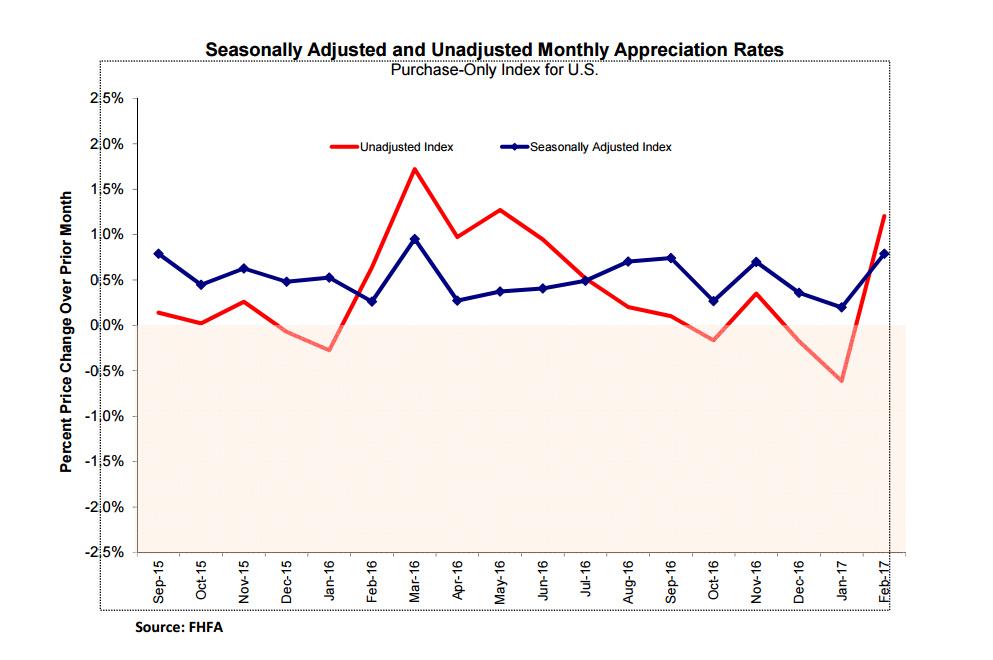
Another index measuring home prices was released by the
Federal Housing Finance Agency (FHFA), which determined prices rose 0.8 percent from January to February. For the nine census divisions, seasonally adjusted monthly price changes from January to February ranged from a 0.1 percent drop in the South Atlantic division to 1.8 percent upturn in the East South Central division. The 12-month changes were positive for all census divisions, ranging from 4.6 percent in the Middle Atlantic division to 9.5 percent in the Mountain division.