Active listings of homes for sale continued to grow in June, increasing by 36.7% annually, according to Realtor.com’s June Housing Report. While June inventory was much improved from the previous three years, and built upon May’s 35% year-over-year increase, inventory was still down 32.4% compared with typical 2017 to 2019 levels, according to the report.
Nationally, all four regions experienced annual inventory increases. The South and the West had the highest growth, with increases of 48.7% and 36.5%, respectively, followed by the Midwest (21%) and Northeast (11.8%). Meanwhile, the median home spent 45 days on the market in June, an increase of two days compared to last year.
Rising inventory levels and a longer time on market both contribute to a slight directional shift towards a buyer-friendly market.
“While the quantity of homes on the market still trails pre-pandemic levels, home buyers are seeing more options to choose from as inventory increases,” said Danielle Hale, chief economist for Realtor.com. “The combination of more for-sale homes and longer time on the market is beneficial for home shoppers as they have more selection and don’t need to feel as rushed in picking a place to call home.”
Despite the monthly (+1 day) and annual rise in time on market, all regions are experiencing shorter time on market than before the pandemic. The West, however, is very close to its pre-pandemic timeframe, with homes spending only one day less on the market compared with the typical June from 2017 to 2019.
Worsening home affordability in the second quarter helps to explain why homes are sitting longer on the market, though Fannie Mae’s latest Home Purchase Sentiment Survey improved monthly and annually in June.
“Whether this translates into more home sales will likely hinge on how mortgage rates impact affordability in the second half of the year,” Hale continued.
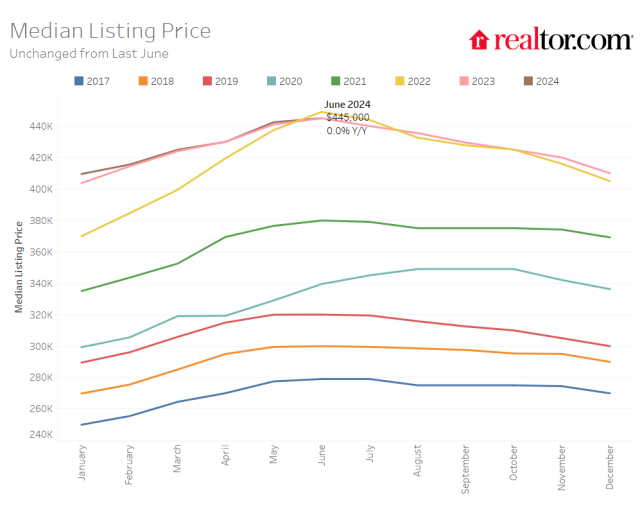
Among the large metros Realtor.com tracks for the monthly report, median list prices in Cleveland (+14.7%), Philadelphia (+11.3%), Rochester (+9.3%), Providence (+8.9%), and St. Louis (+8.8%) tallied the largest increases. San Francisco (-13.2%), Miami (-11.5%), Denver (-6%), Austin (-5.2%) and Kansas City (-5%) experienced the greatest price declines.
Median time on market rose the most in Phoenix (+14 days), Tampa (+8 days), Jacksonville (+7 days), and Portland (+7 days), while falling the most in Chicago (-9 days), Providence (-9 days), San Jose (-9 days), and Buffalo (-8 days).
“While sellers are responding to market signals by cutting prices more frequently, data suggests they aren't calling it quits and pulling their homes off of the market,” said Ralph McLaughlin, senior economist for Realtor.com. “Despite these cuts, price growth is hanging around at high enough rates to keep sellers in the game.”