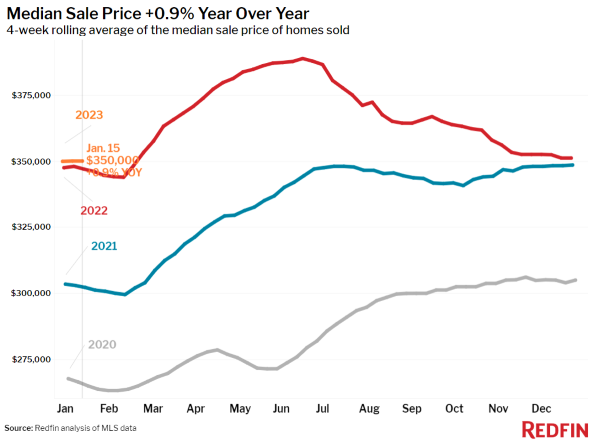
The median U.S. home-sale price increased 0.9% from a year earlier to $350,250 during the four weeks ended Jan. 15, according to a new report from Redfin.
The technology-powered real estate brokerage said prices remain elevated because buyer activity has picked up as mortgage rates declined due to slowing inflation.
Average mortgage rates dropped to 6.15% during the week ended Jan. 19, their lowest level since September. Pending home sales fell 29% year over year — a significant decline, but the first sub-30% drop in three months — but mortgage-purchase applications rose 25% from the week before during the week ended Jan. 13, a jump that’s likely to lead to more pending sales in the coming months, the company said.
As demand slowly returns, some homeowners are less reluctant to sell. New listings of homes for sale fell 20% year over year during the four weeks ended Jan. 15, but that’s the smallest decline in two months.
“The people who started browsing homes online and scheduling house tours at the end of 2022 are now turning into actual homebuyers,” said Redfin Deputy Chief Economist Taylor Marr. “Low competition, falling mortgage rates, and seller concessions are bringing some buyers back to the market.”
That, in turn, she said, is helping “keep national home prices afloat, which is one bright spot for sellers. But many buyers are still sitting on the sidelines and demand could dip back down if inflation declines slower than expected or mortgage rates rise again.”
Prices fluctuating
Home-sale prices fell year over year in 18 of the 50 most populous U.S. metros during the four weeks ended Jan. 15. By comparison, 20 metros saw a price decline during the previous four-week period, while 11 metros saw price declines a month earlier.
Prices fell 10.1% year over year in San Francisco; 6.7% in San Jose, Calif.; 5.5% in Austin, Texas; 4.3% in Detroit; 3.8% in Seattle; 3.7% in Phoenix; 3.4% in Sacramento, Calif.; 3.1% in San Diego; 2.8% in Anaheim, Calif.; 2.5% in Chicago; 2.4% in Los Angeles; 2.3% in Oakland; and 2.2% in Boston. They fell less than 2% in Riverside, Calif.; Portland, Ore.; New York; Newark, N.J.;, and Las Vegas.
Leading indicators of homebuying activity:
- For the week ended Jan. 19, 30-year mortgage rates dropped to 6.15%. The daily average was 6.04% on Jan. 18.
- Mortgage-purchase applications during the week ended Jan. 13 jumped 25% from a week earlier, seasonally adjusted. Purchase applications were down 35% from a year earlier.
- Google searches for “homes for sale” rose about 30% from their November low during the week ended Jan. 14, but were down about 26% from a year earlier.
Key takeaways for 400+ U.S. metro areas:
Unless otherwise noted, the data covers the four-week period ended Jan. 15. Redfin’s weekly housing market data goes back through 2015.
- The median home sale price was $350,000, up 0.9% year over year, the biggest gain in a month.
- The median asking price of newly listed homes was $357,200, up 3.9% year over year, the biggest increase in two months.
- The monthly mortgage payment on the median-asking-price home was $2,262 at the current 6.15% mortgage rate. That’s unchanged from a week earlier and down $245 from the October peak. Monthly mortgage payments are up 30% from a year ago.
- Pending home sales were down 29.1% year over year. That’s the first sub-30% drop in three months.
- Among the 50 most populous U.S. metros, pending sales fell most in Las Vegas (-63% YoY); Phoenix (-56.3%); Austin (-53.7%); Nashville (-52.9%); and Jacksonville, Fla., (-52.4%). Though pending sales fell in all 50 metros, they declined least in Chicago (-12.8%); Pittsburgh (-20.1%); San Francisco (-23.2%); Boston (-24.4%); and Cleveland (-25%).
- New listings of homes for sale fell 20% year over year.
- Active listings (the number of homes listed for sale at any point during the period) were up 21.8% from a year earlier, the biggest annual increase since at least 2015.
- Months of supply — a measure of the balance between supply and demand, calculated by dividing the number of active listings by closed sales — was 4 months, up from 3.7 months a week earlier and 2 months a year earlier.
- 29% of homes that went under contract had an accepted offer within the first two weeks on the market, up slightly from the week before but down from 36% a year earlier.
- Homes that sold were on the market for a median of 45 days, up two weeks from 31 days a year earlier and the record low of 18 days set in May.
- 21% of homes sold above their final list price, down from 40% a year earlier and the lowest level since March 2020.
- On average, 4.3% of homes for sale each week had a price drop, up slightly from a week earlier but down from 5.3% a month earlier.
- The average sale-to-list price ratio, which measures how close homes are selling to their final asking prices, fell to 97.9% from 100.1% a year earlier. That’s the lowest level since March 2020.