Despite the increase in mortgage rates hitting a plateau, rate-lock volume continued to slide in May, with declines seen across all loan types, according to a monthly report from Black Knight.
The software, data, and analytics company today released its Originations Market Monitor report for May, analyzing daily rate-lock data from Black Knight’s Optimal Blue PPE — a widely use mortgage pricing engine — which the company claims provides the earliest and most comprehensive view of origination activity.
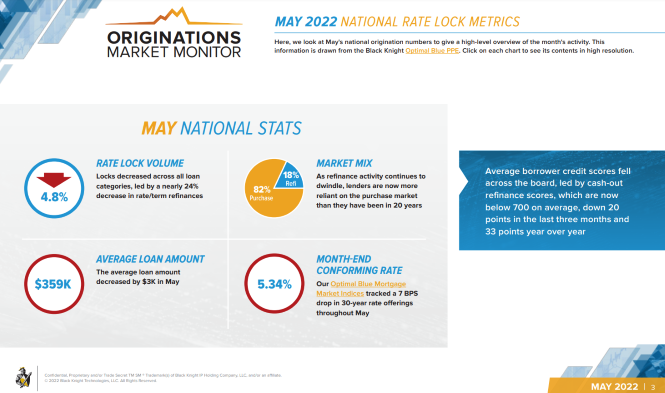
“At the start of May, it seemed mortgage interest rates would continue their upward climb and, indeed, rates did rise above 5.5% before pulling back some 20 basis points,” Scott Happ, president of Optimal Blue, a division of Black Knight, said. “Ultimately, our OBMMI (Optimal Blue Mortgage Market Indices) daily interest rate tracker showed 30-year conforming offerings finishing the month at 5.34%, down 7 basis points from last month.”
The month’s pipeline data, however, showed overall rate lock volume down 4.8% from April, with rate/term refinance lending activity down another 23.6% from April to mark an 89.9% year-over-year decline, Black Knight said.
Cash-out refinance locks also fell (-11.9%) and are now down 42.2% since last year, the company said.
The combined decline in refinance locks pushed the refi share of the market down to just 18%, the lowest point on record since at least January 2018, when Optimal Blue began tracking the metric.
Purchase lock volumes also were down 2.3% from April, and were flat year-over-year. However, when looking at lock counts to exclude the impact of home price appreciation on volumes, purchase locks were down 8.5% year-over-year in May, Black Knight said.
Government loan products gained market share, as FHA and VA lock activity increased at the expense of agency volumes, a trend also likely reflected in the decline seen in the average loan amount from $362,000 to $359,000, Black Knight said.
Average credit scores also fell in May, led by another steep drop in cash-out refinance scores, which are now below 700 on average, down 20 points in the last three months and 33 points year-over-year, it said.
“The month’s data shows a market struggling under the weight of significantly higher rates than Americans have enjoyed for the better part of the last three years,” Happ said. “We’ve seen rate/term refinance activity essentially evaporate, and cash-out activity is now suffering as well. While there is volume pressure across the board due to rising rates, purchase volumes are holding up the best and are now driving 82% of all origination activity.”
He continued, “Lenders are now more reliant on the purchase market for origination volumes than they have been in 20 years. Meanwhile, the trifecta of low inventory, high prices, and climbing rates that has created the least affordable housing market in 16 years continues to create headwinds for precisely that segment.”
Black Knight’s monthly Originations Market Monitor provides origination metrics for the U.S. and the top 20 metropolitan statistical areas by share of total origination volume. You can read the full report at www.blackknight.com.