Following seven straight months of declines, home prices rose in February thanks to low inventory and a small increase in demand, Black Knight Inc. said Monday.
Black Knight’s Data & Analytics division released its latest Mortgage Monitor Report, based on the company’s mortgage, real estate, and public records data sets, and the report’s Home Price Index showed that prices rose in February on both a non-adjusted and seasonally adjusted basis.
Andy Walden, vice president of enterprise research for Black Knight, said a widespread shift occurred, with prices rising for the month in 78% of the 50 largest U.S. markets.
“February’s national increase in home prices — up 0.16%, adjusted for seasonality — marked the first positive monthly growth we’ve seen in eight months,” Walden said. “Daily transaction info from Black Knight Collateral Analytics and our Optimal Blue rate lock data show that the purchase market increased when rates declined in the early part of the month and borrowers were quick to take advantage of limited inventory.”
In many areas of the country, he continued, “that dynamic — low inventory and a modest rise in demand — led to an uptick in home prices. All in, 39 of the 50 largest U.S. markets saw prices increase in February, in sharp contrast to just three months earlier, when 48 of those 50 were experiencing price declines.”
By Region
The largest price increases occurred in Miami (+0.63%), along with Cincinnati (+0.55); Columbus, Ohio (+0.53%); Hartford, Conn. (+0.52%); Memphis, Tenn. (+0.51%); and Cleveland (+0.50%).
On the other end of the spectrum, the largest price declines were in Austin, Texas (-0.82%); Las Vegas (-0.53%); San Jose, Calif. (-0.52%); Salt Lake City, Utah (-0.5%); Sacramento, Calif. (-0.37%); Seattle (-0.34%), San Francisco (-0.32%); Riverside, Calif. (-0.27%); Los Angeles (-0.23%); and Phoenix (-0.22%).
Walden said some price increases, such as in Miami, can be attributed to people moving to the area. However, he said, “we’re seeing stronger price gains more generally in those areas with better affordability and larger inventory deficits.”
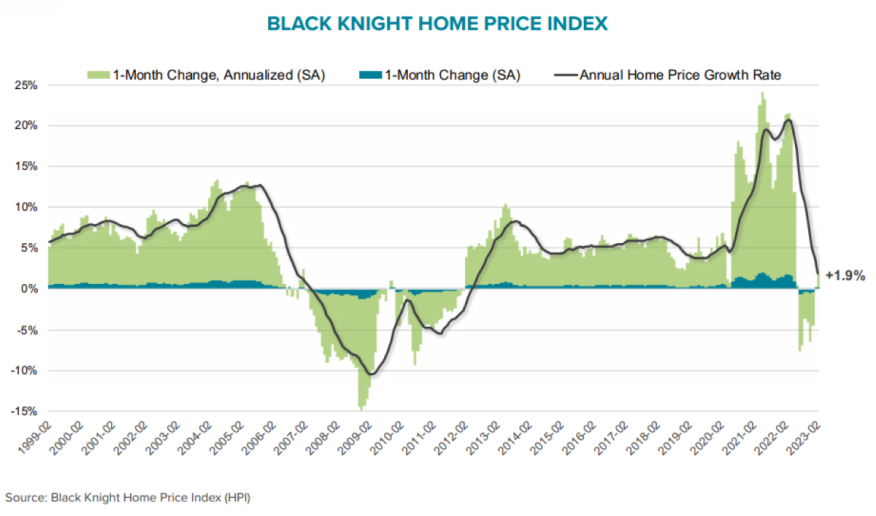
He noted that the “backward-looking national annual home-price growth rate” continued to decline, falling to 1.94% — the first time it’s been under 2% since 2012. “While that national number is still on track to fall below 0% in April, if inventory challenges and easing interest rates persist, they may well push it back into positive territory later this year,” Walden said.
“The unfortunate reality is that the scarce supply of inventory that’s the source of so much market gridlock isn’t getting any better,” he added. “In fact, seasonally adjusted inventory levels continued to deteriorate in February, marking not only the fifth straight month of such declines, but also the largest inventory deficit we’ve seen since May of last year, with more than 90% of markets seeing such deficits grow in February.”
In addition, new listings, which have been trending well below pre-pandemic levels for months, fell 27% below those levels in February as potential home sellers continued to shy away from the market.
“All in, total active for-sale inventory is back to 47% below pre-pandemic levels after having recovered to within 38% of normal levels late last year,” Walden said. “Without a significant shift in interest rates, home prices or household income, this is a self-fulfilling dynamic that is quite likely to continue for some time.”
The latest Mortgage Monitor Report also surveys the equity landscape, finding that February’s price gains have also helped shore up what had been falling homeowner equity levels. At $14.6 trillion, overall total equity for mortgage holders is now down $2 trillion (-12%) from its 2022 peak.
Tappable equity — the amount available for withdrawal while maintaining a 20% equity stake in the property — was down $1.6 trillion (-15%). Even so, tappable equity was at $9.3 trillion as of the end of February, which is still up 56% (+$3.4 trillion) over the past three years.
The average mortgage holder has $178,000 in tappable equity, down from more than $210,000 early last year, but still $61,000 (54%) above the market average three years ago. The total current combined loan-to-value (CLTV) ratio for the mortgage market now sits at 46.8%, noticeably higher than the record low of just under 43% early last year, but historically still very low, and below any level prior to 2021, the report states.
Other Highlights
- At 3.45%, the national mortgage delinquency rate increased 7 bps in February, but is down 13% year over year. February’s 2% increase in delinquencies was driven by a 7.1% rise in borrowers 30-days past due.
- February foreclosure starts dropped 9.4% to 29,000, breaking a four-month streak of increases.
- Serious delinquencies continued to improve nationally, falling by 17,000, with 45 states seeing volumes shrink in February.
- While Freddie Mac’s 30-year PMMS rate of 6.42% is down from 6.73% earlier in the month and may be poised to trend lower in coming weeks, it’s still higher than the 6.26% average from February. That, along with a modest rise in home prices, has led to slightly worse affordability levels than we were seeing earlier this year.
- It currently requires 33.2% of the national median household income to afford the median-priced home, roughly equivalent to the peak of the market in 2006, and well above the long run average of ~25%.