Home prices reached a new all-time high in March 2024, with month-over-month price increases in all major U.S. markets.
That’s according to the S&P CoreLogic Case-Shiller U.S. National Home Price NSA Index and the Federal Housing Finance Agency's (FHFA) seasonally adjusted monthly Home Price Index (HPI), each released Tuesday.
U.S. house prices rose 6.6% between the first quarter of 2023 and the first quarter of 2024, according to the FHFA’s HPI. Meanwhile, the S&P CoreLogic reported a 6.5% annual gain for March, the same increase as the previous month.
“U.S. house prices continued to grow at a steady pace in the first quarter,” said Dr. Anju Vajja, deputy director for FHFA’s Division of Research and Statistics. “Over the last six consecutive quarters, the low inventory of homes for sale continued to contribute to house price appreciation despite mortgage rates that hovered around seven percent.”
The S&P’s 10-City Composite increased 8.2% in March, up from an 8.1% increase the month prior. The 20-City Composite posted a slight year-over-year increase to 7.4%, up from a 7.3% increase in the previous month.
“This month’s report boasts another all-time high,” says Brian Luke, head of commodities, real & digital assets at S&P Dow Jones Indices. “We’ve witnessed records repeatedly break in both stock and housing markets over the past year. Our National Index has reached new highs in six of the last 12 months. During that time, we’ve seen record stock market performance, with the S&P 500 hitting fresh all-time highs for 35 trading days in the past year.”
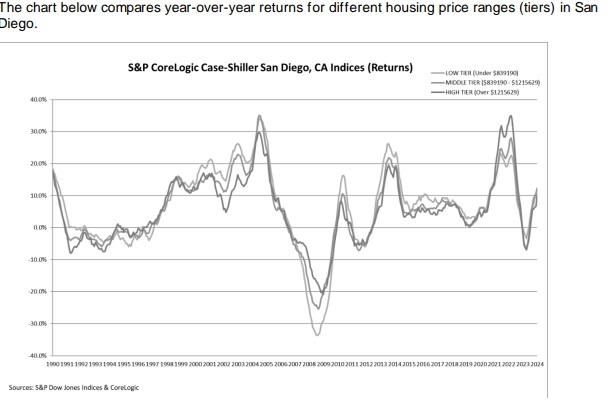
The highest year-over-year gain occurred in San Diego, which saw an 11.1% increase in March, followed by New York and Cleveland, with increases of 9.2% and 8.8%, respectively.
“The two largest population centers make up about 30% of the 20-City Composite and have shown significant recovery, keeping pace with our national composite annualized return of 9.9% since 2020,” Luke continued. “San Francisco and Seattle are still trailing previous highs, currently 9.7% and 8.2% lower than in May 2022, respectively. While Southern California ranked among the best annually, Seattle and San Francisco recorded the strongest monthly gains.”
House prices rose in 50 states between the first quarter of 2023 and the first quarter of 2024, according to the FHA’s report. The five states with the highest annual appreciation were Vermont, (12.8%) New Jersey, (11.6%) New York, (10.9%) Delaware, (10.7%) and Wisconsin, (9.9%). The District of Columbia had a decline of -1.5%.
The report also records home price increases in 97 of the top 100 largest metropolitan areas over the last four quarters. The annual price increase was the greatest in Allentown-Bethlehem-Easton, PA-NJ, at 16%. The metropolitan area that experienced the most significant price decline was Urban Honolulu, Hawaii at -3.2%.
April Home Price Activity
According to First American Data & Analytics’ Real House Price Index, April 2024 told a different story. Mortgage rates continued their spring surge in April 2024, rising to the highest level in five months and helping drag affordability down by 1.5% compared with March, the index reported.
Real house prices increased 1.5% between March 2024 and April 2024. Year over year, real house prices increased 9.0% between April 2023 and April 2024. The RHPI revealed that real house prices are 45.1% more expensive than in January 2000.
On an annualized basis, affordability decreased by 9%. The RHPI cited two factors drove the year-over-year decline in affordability – a 6.0% annual increase in nominal house prices and a 0.65 percentage point increase in the average 30-year, fixed mortgage rate compared to last year.
A recent uptick in inventory amid a pullback in demand due to declining affordability signaled cooling price appreciation nationally. Annual national house price growth peaked in the spring of 2022 at over 20%, but has since slowed to 6%, which is still robust by historical standards.
However, house price trends vary by market, and house prices in some markets have fallen further and faster than others. House prices have fallen below their respective peaks in 37 of the top 50 markets that First American tracks as of April, which is five more markets than in March.
The market with the greatest decline was Austin, Texas, where nominal house prices peaked in June 2022, but have since declined by 7.8% as the housing market rebalances. Austin was at the forefront of the U.S. housing boom, making it a leading pandemic ‘boomtown.’