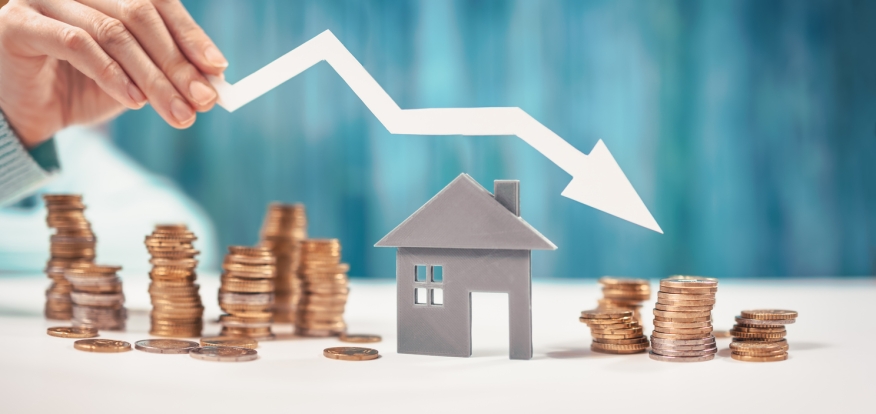
Two different monthly housing price indexes found essentially the same thing happening in the housing market this summer: rising home prices hit the brakes.
The Federal Housing Finance Agency (FHFA) House Price Index, released Tuesday, found that housing prices fell 0.6% in July from June, while still rising 13.9% from a year earlier. The previously reported 0.1% price increase in June 2022 remained unchanged.
For the nine census divisions, seasonally adjusted monthly house-price changes from June to July ranged from -1.6% in the Pacific division to +0.1% in the East North Central division. The 12-month changes, however, were all positive, ranging from +10% in the Pacific division to +18.9% in the South Atlantic division.
“U.S. house price index posted its first month-over-month decrease in July since May 2020, when the U.S. economy experienced lockdowns as a result of COVID-19,” said Will Doerner, Ph.D., supervisory economist in FHFA’s Division of Research and Statistics. "This decline was widespread, as eight of the nine census divisions saw a decrease. The 12-month change in house prices remains at historically high rates, but the rate of growth continues to moderate across all census divisions.”
Similarly, the S&P CoreLogic Case-Shiller U.S. National Home Price NSA Index reported a 15.8% annual gain in July, but that was down from an 18.1% year-over-year increase in June.
The 10-City Composite annual increase came in at 14.9%, down from 17.4% in June. The 20-City Composite posted a 16.1% year-over-year gain, but that also was down from 18.7% in the previous month.
Tampa, Miami, and Dallas reported the highest year-over-year gains among the 20 cities in July. Tampa led with a 31.8% year-over-year price increase, followed by Miami with a 31.7% increase. All 20 cities reported lower price increases in the year ending in July versus the year ending in June.