Black Knight’s Monthly Monitor Report, released today, found that May marked the second-consecutive month of cooling at the national level. However, even with growth slowing in 97 of the top 100 U.S. markets, overall home prices still rose 1.5% from April.
According to Black Knight Data & Analytics President Ben Graboske, tappable equity — the amount available for mortgage holders to borrow against while retaining a 20% equity stake in their homes — has reached another all-time high.
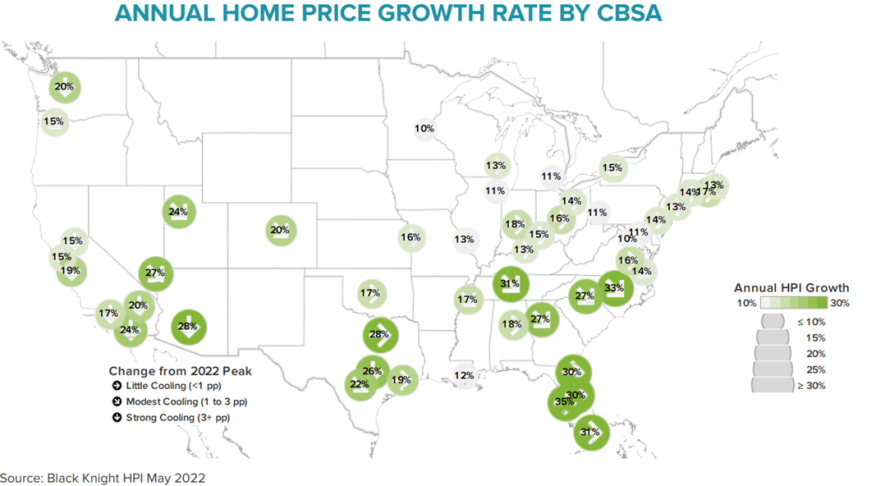
“Home price growth cooled — albeit very slightly — in April,” Graboske said. “While a downward shift from 20.4% to 19.9% annual growth is hardly cause for concern, it’s also likely we’ve not yet seen the full impact of recent rate increases. Rather, April’s decline is more likely a sign of deceleration caused by the modest rate increases in late 2021 and early 2022, when rates first began ticking upwards.”
The Mortgage Monitor also looked at record-low for-sale inventories, which is a key contributing factor to home prices and affordability. Despite seeing an increase of 27,500 from March to April, active listings remain 67% below pre-pandemic levels, with 820,000 fewer listings than would be typical at this point in most home-buying seasons.
While new listing volumes were up 1% from the same time last year, they remained 11% below pre-pandemic levels for the month of April, which is still below what would be considered normal listing volumes. May saw the largest jump in housing inventory in the past five years, but for-sale inventory remains at a 60% deficit.
“All major markets are still facing inventory deficits, but some have seen their shortages shrink much faster than others," Graboske said. "Among these are some of the hottest housing markets in recent years: San Francisco, San Jose and Seattle. Unsurprisingly, these are also among the markets seeing the strongest levels of cooling so far this year, with annual home-price growth rates in each down more than three percentage points in recent months.”
Affordability remains a key obstacle in buying activity. With 30-year rates hovering close to 6% and home prices up nearly 11% since the start of 2022, affordability is at its worst point since the mid-1980s. Additionally, U.S. home prices are up 42% since the start of the pandemic, with the average home having gained almost 9% in value just since the start of 2022.