FDIC economist finds disparities diminish when implementing new data on risk factors, but they still exist.
KEY TAKEAWAYS
Studies using pre-2018 HDMA data that claimed to show intentional or unintentional racial bias by lenders have been criticized by banks and credit unions saying the data lacked necessary detail to determine that.
Since 2018, HMDA has included data used to make loan decisions, including the applicants’ credit score, debt-to-income ratio, and loan-to-value ratio.
Blacks and Hispanics had denial rates that were still 2 to 3 percentage points higher than those for non-Hispanic white applicants.
Minority borrowers also paid more than whites for loans after controls. On a $200,000 30-year purchase loan, Blacks paid $1,583 more than similar white borrowers for conventional loans and $542 more for FHA loans.
An economist from the Federal Deposit Insurance Corporation (FDIC) found racial disparities in mortgage lending persist even after weighting costs and denial rates with the greater range of data available under the recent Home Mortgage Disclosure Act (HDMA).
The HMDA, enacted in 1975, is a federal law requiring certain financial institutions to provide mortgage data to the public.
FDIC Senior Financial Economist Stephen J. Popick examined the HDMA numbers from 2020, which include a wider array of data on credit risks and costs than pre-2018 data.
His paper, released June 9 by the FDIC, showed the extent the racial and ethnic differences diminish. The remaining differences might be bias or they may “reflect the importance lenders place on non-HMDA reportable data fields, such as residency and employment stability requirements, bankruptcies and previous foreclosures.”
“Therefore, differences in loan underwriting or loan pricing decisions between population groups in this paper should not be interpreted as evidence of discrimination under fair lending,” he wrote.
Get the NMP Daily
Essential stories, every weekday.
Studies using pre-2018 HDMA data that claimed to show intentional or unintentional racial bias by lenders have been criticized by banks and credit unions saying the data lacked necessary detail to determine that. When the data collection was expanded to include more of those relevant details, they complained of regulatory burden, and pushed to exempt smaller institutions from being required to provide data.
Since 2018, HMDA has included data used to make loan decisions, including the applicants’ credit score, debt-to-income ratio, and loan-to-value ratio. This new data allows greater analysis of pricing including interest rates, discount points, lender credits, points, and fees.
Previously, HMDA data did not include credit factors commonly used by lenders to make loan decisions. So, pre–2018 studies only showed raw, unadjusted differences between Blacks, Hispanics, and non-Hispanic whites.
“While researchers used pre-expansion HMDA data to understand mortgage lending patterns, they could not easily account for differences in credit risk affected by those patterns,” Popick wrote.
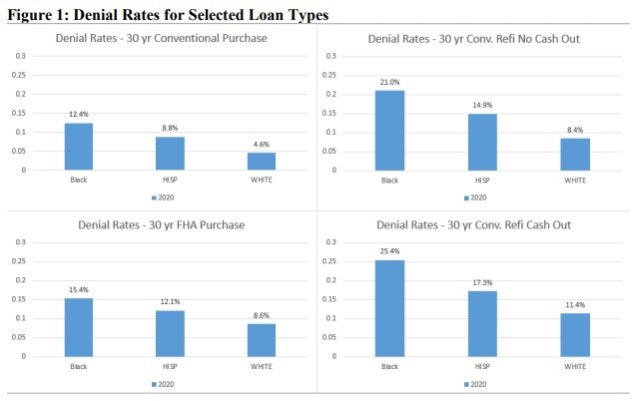
Popick compared raw denial rates with those controlled for credit factors, lender characteristics (such as total origination volume), timing of the loan, and the location of the loan. He found these controls explained about 70% of the difference in denial rates for conventional loans.
“The impact of these controls on denial rate differences in FHA lending is noticeably lower, though it likely reflects that minority and white borrowers are more similar in FHA purchase lending than in conventional lending and that underwriting requirements are quite different between these two loan types,” he wrote.
After taking these controls into account, Blacks and Hispanics had denial rates that were still 2 to 3 percentage points higher than those for non-Hispanic white applicants.
Denial Rates For Black, Hispanics, and whites by loan type, provided by the FDIC.
Minority borrowers also paid more than whites for loans after controls. On a $200,000 30-year purchase loan, Blacks paid $1,583 more than similar white borrowers for conventional loans and $542 more for FHA loans through interest, discount points, lender credits and fees. The costs were cumulative over 30 years with the payments adjusted to present value.
Additional findings from Popick’s study showed:
Black borrowers paid $1,211 more for a conventional no cash-out refinance on a 30-year, 200,000 loan, and $1,909 more for a conventional cash-out refinance.
Hispanic borrowers paid $1,725 more for a conventional 30-year, $200,000 purchase loan. However, the cost disparities with whites were substantially lower on other types of loans than the disparities between Blacks and whites.
For conventional purchase lending among prime borrowers(those with credit scores above 660), interest rate differences between minority and white borrowers in the same credit score bin fall as credit scores rise.
The Non-QM investor says the platform’s AI agents can process documents, resolve workflow tasks, and work with proprietary lending guidelines
Verus Mortgage Capital has replaced its legacy loan origination system with Vesta’s platform, deploying new automation and artificial intelligence tools across its Non-QM operations.Verus purchases non-agency loans from correspondent lenders in all 50 states and the District...
The technology veteran will oversee product execution, platform development, engineering, infrastructure, and cloud strategy
Informative Research (IR) has promoted Ajay Trilokeshwaran to chief technology officer, placing the longtime enterprise technology leader in charge of the company’s product and technology execution.Trilokeshwaran will oversee platform development, application engineering, in...
Contract signings fell 5.4% from May as elevated borrowing costs and record home prices continued to pressure affordability, particularly for first-time buyers
A $432.4 million deal backed by over 1,000 loans shows investors are still hungry for Non-QM paper — but the real story is where the loans are coming from