On Thursday we learned that mortgage originations fell to a 23-year low in the first quarter, so a report from Redfin that pending home sales are way off isn’t a shock.
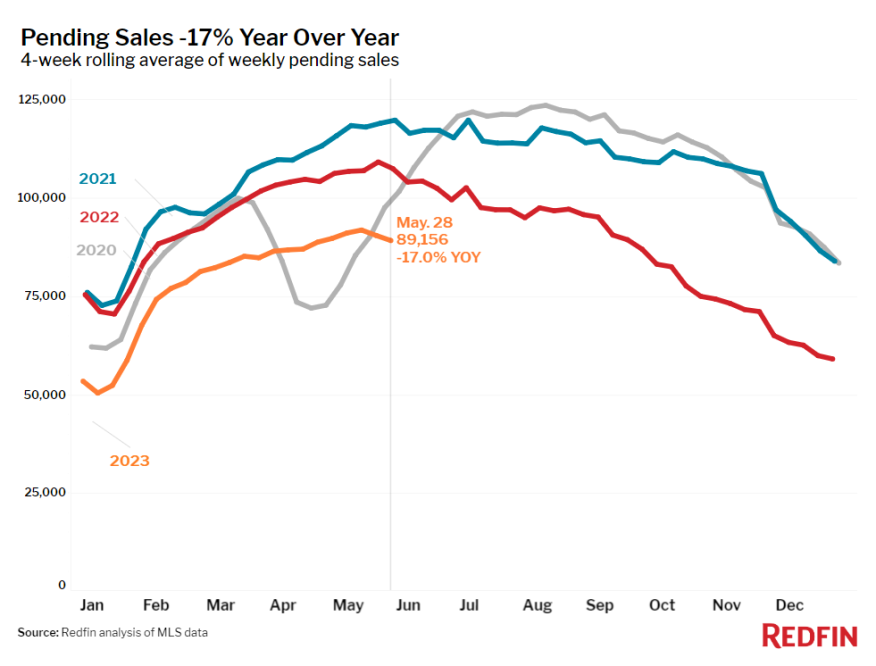
According to a report from the online real estate brokerage, pending home sales during the four weeks ended May 28 fell 17% from a year earlier, one of the biggest declines since the start of the year.
The year-over-year drop is especially notable because pending sales had already started falling at this time last year, as mortgage rates shot up past 5%.
Seasonally adjusted measures of homebuying demand show that it has also dipped in earlier stages of the house-hunting journey, Redfin said. Mortgage-purchase applications and Redfin’s Homebuyer Demand Index — a measure of home tours and other service requests from Redfin agents — are both down about 7% from a month ago.
The Demand Index, however, was up 1% from a year earlier, its first annual increase in more than 12 months. It’s worth noting this measure was dropping quickly a year ago due to rising rates, Redfin said.
Homebuying demand has dipped over the last month due to elevated mortgage rates and a scarcity of homes for sale. Average weekly rates hit 6.79% this week, their highest level since November. That has priced many people out of the housing market; the typical U.S. homebuyer’s monthly housing payment hit a record high of $2,651 this week, up roughly $350 from a year ago.
Limited inventory is also a major factor holding back sales: New listings dropped 23% year over year, and the total number of homes for sale fell 3%, the second annual decline in 12 months (the first was during the prior four-week period, when they fell 0.2%). The lack of homes on the market is propping up prices, with the median U.S. sale price down 1.9% year over year, the smallest decline in two months.
Bay Equity, Redfin’s mortgage company, says many prospective buyers haven’t bowed out entirely. They’re ready to make offers and lock in mortgages when rates drop down closer to 6% and more listings hit the market, it said.
“It’s been a weird week,” said Heather Mahmood-Corley, a Redfin Premier agent in Phoenix. “Some buyers are putting in all-cash offers. Other house hunters have put their search on hold, waiting for mortgage rates to come down and more listings to come on the market, and some of the more financially savvy buyers are moving forward with mortgage-rate buydowns or plans to refinance in the future.”
She added, “The silver lining of today’s housing market is that limited listings are propping up prices, making it so sellers are still able to get a favorable price.”
Leading Indicators Of Homebuying Activity
- For the week ended June 1, the average 30-year fixed mortgage rate was 6.79%, up from 6.57% the week before — the biggest weekly increase since October. It’s also the highest rate since November. The daily average was 6.88% on May 31.
- Mortgage-purchase applications during the week ended May 26 decreased 3% from a week earlier, seasonally adjusted. Purchase applications were down 31% year over year.
- The seasonally adjusted Redfin Homebuyer Demand Index was down 4% from a week earlier during the week ended May 28. It was up 1% from a year earlier, the first annual increase in over a year, which reflects the fact that demand was dropping at this time in 2022 as mortgage rates rose.
- Google searches for “homes for sale” were down 12% from a month earlier during the week ended May 27, and down about 13% YOY.
- Touring activity as of May 29 was up 2% from the start of the year, compared with a 6% increase at the same time last year, according to home tour technology company ShowingTime.
Key Housing Market Takeaways
Unless otherwise noted, this data covers the four-week period ended May 28. Redfin’s weekly housing market data goes back through 2015. For items that include metro-level breakdowns, Redfin analyzed the 50 most populous U.S. metros; select metros may be excluded to ensure data accuracy.
- The median home sale price was $377,750, down 1.9% YOY, the smallest annual decline in two months.
- Home-sale prices declined in 30 metros, with the biggest drops in Austin, Texas (-16.4% YoY), Oakland, Calif. (-11.5%), Las Vegas (-9.9%), San Francisco (-8.6%), and Sacramento, Calif. (-8.5%).
- Sale prices increased most in Milwaukee (9.3%), Cincinnati (6.4%), Miami (5.7%), Fort Lauderdale, Fla. (5.4%), and Newark, N.J. (4.7%).
- The median asking price of newly listed homes was $398,413, essentially unchanged (+0.1%) YOY.
- The monthly mortgage payment on the median-asking-price home hit a record high of $2,651 at a 6.79% mortgage rate, the current weekly average. That’s up 15% ($348) YOY.
- Pending home sales were down 17% year over year, the second-biggest decline since January. The biggest was a week earlier, when pending sales declined 17.1%.
- Pending home sales fell in all metros Redfin analyzed. They declined most in Seattle (-31.8% YoY), San Diego (-31.4%), Portland, Ore. (-30.1%), Sacramento (-26.3%) and Milwaukee (-25.8%).
- New listings of homes for sale fell 23.4% YOY, adding to a 10-month streak of double-digit declines.
- New listings declined in all metros Redfin analyzed. They fell most in Las Vegas (-42.3% YoY), Oakland (-39.8%), Seattle (-39.4%), San Diego (-37.1%) and Phoenix (-36.8%).
- Active listings — the number of homes listed for sale at any point during the period — dropped 2.9% YOY, the second decline in 12 months. The first was a week earlier, when active listings declined 0.2% YOY. Active listings also inched down (about -0.2%) from a month earlier; typically, they post month-over-month increases at this time of year.
- Months of supply — calculated by the number of months it would take for the current inventory to sell at the current sales pace — was 2.7 months, up from 2.1 months a year earlier. Four to five months of supply is considered balanced, with a lower number indicating a seller’s market.
- Of the homes that went under contract, 34.9% had an accepted offer within the first two weeks on the market, down from 40% a year earlier but up from 33% a month earlier.
- Homes that sold were on the market for a median of 29 days, the shortest span since September. That’s up from a record low of 18 days a year earlier.
- Of the homes that sold, 34.7% were sold for above the final list price. That’s the highest share since September, but down from 54% YOY.
- On average, 5.2% of homes for sale each week had a price drop, up from 3.9% a year earlier.
- The average sale-to-list price ratio, which measures how close homes are selling to their final asking prices, was 99.7%. That’s the highest level since August but is down from 102.5% a year earlier.